
99 cities · 15 counties · October 2026
Arizona Market Reports for Homes and Condos: October 2026
Arizona Market Reports help buyers and sellers read the Arizona homes and condos market by city and county. Use the county cards and the 99-city table below to open any full report. These figures match our homepage market block: all home types, refreshed for October 2026.
Browse Arizona Market Reports for Phoenix, Tucson, Flagstaff and every tracked town. Compare Arizona city market reports side by side, then open Arizona county market reports when you need the wider view. Monthly Arizona market data on this hub stays aligned with the homepage explorer.
Arizona Market Reports key facts for October 2026
Quotable figures from Arizona Market Reports covering the Arizona homes and condos market. Each fact ties back to a county or city page you can open from the directories below.
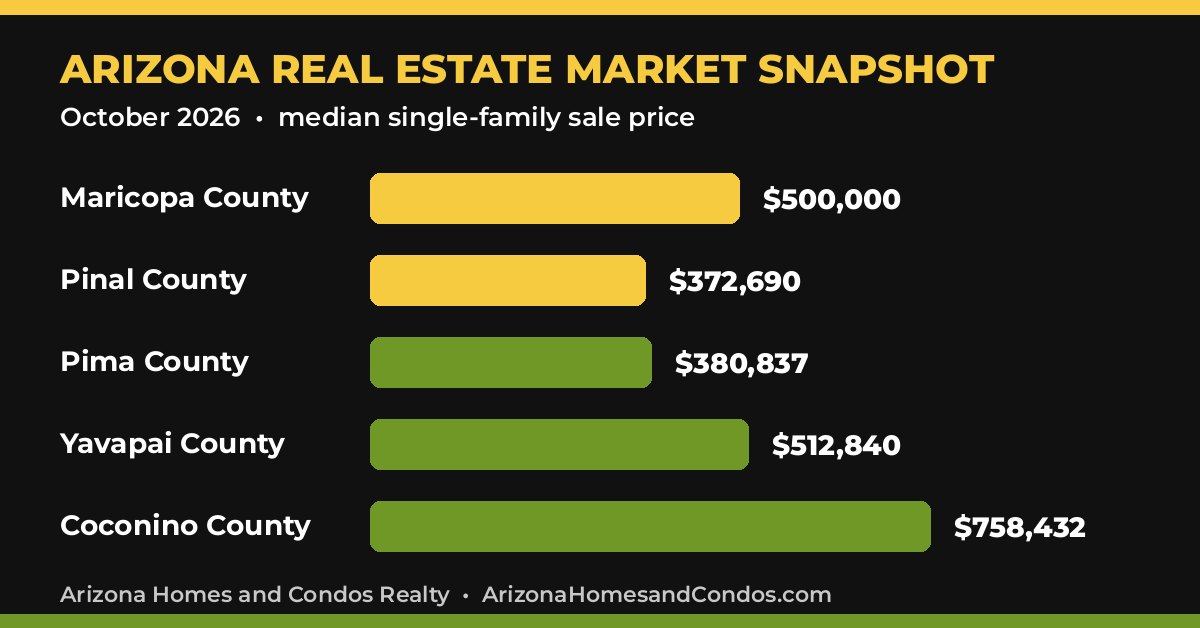
Key factMaricopa County’s median sale price for all home types was $473,939, -2.7% vs. a year earlier, on 4,588 homes sold in our October 2026 release.
Key factCoconino County had the highest county median we publish at $723,381; Graham County was the lowest at $199,454 on 5 sales.
Key factOf the 99 cities and towns in the explorer, 49 show a higher median price than a year earlier and 50 a lower one.
Key fact15,780 homes were for sale in Maricopa County, and the median home sold after 67 days on market in this monthly Arizona market data.
How to use Arizona Market Reports: city vs county
Arizona Market Reports work best when you match the report type to the decision. City pages answer what is happening in one town. County pages answer what the wider area is doing.
Arizona city market reports
Open a city page when you already have a town in mind. Explorer figures count all home types over the latest three months, which steadies results in smaller towns. Tap Report to read the full single-family deep dive, neighborhood notes and buyer guidance.
Arizona county market reports
Open a county page when you are comparing a wider area or deciding between metros. County cards show the latest month for all home types. Greenlee County had no published closed sales, so its card uses labeled listing data.
Arizona homes and condos market at a glance
The Arizona homes and condos market moves differently by metro. Phoenix-area towns often follow Maricopa County trends, while Tucson, Prescott, Flagstaff and river cities can diverge on price and days on market. Reading both levels keeps you from pricing a home or condo from a statewide headline alone.
Also useful: What is my Arizona home worth? and the Arizona Counties Real Estate Guide 2026 hub.
What Arizona Market Reports metrics mean
Before you sort the explorer, know what each column is measuring. This is guidance for reading the numbers, not a forecast.
Reading monthly Arizona market data columns
Arizona Market Reports use the same high-level metrics as our other monthly Arizona market data pages:
- Median sale price is the middle closed price, so a few luxury sales do not skew the number the way an average can.
- Change vs. last year and vs. prior month show direction for the Arizona homes and condos market without guessing future prices.
- Days on market is how long a typical sold home sat before closing.
- Homes sold and homes for sale show activity and listing supply.
- Months of supply on county cards is calculated from active listings divided by monthly sales (or pending sales where closed sales were not published).
We do not invent closed-sales numbers. Every Arizona Market Reports figure on this hub is checked against the same data files that power the homepage. If a town had no published sales, its explorer row uses ZIP-level or county figures and says so under the name.
Use monthly Arizona market data to shortlist areas, then confirm details on the linked page before you write an offer or set a list price. The hub view is all home types; many linked pages emphasize single-family homes, so expect those tables to differ when condos make up a large share of sales.
Arizona Market Reports by county: all 15 counties
These Arizona county market reports cards match the homepage grid. Tap a county to open its full report.
Arizona real estate figures for all 15 counties. Figures count all home types sold in each county in the latest month; homes for sale counts active listings during the month. Greenlee County had no published closed sales, so its card shows listing data and says so. Months of supply (calculated: active listings divided by monthly sales) uses each county’s latest-month figures; for Greenlee County it divides active listings by pending sales.
Apache County
$332,256
Median sale price, all home types
- vs. last year
- -5.1%
- vs. prior month
- +9.1%
- Days on market
- 80
- Homes sold
- 28
- Homes for sale
- 204
- Months of supply (calculated)
- 7.3
Cochise County
$282,867
Median sale price, all home types
- vs. last year
- -4.8%
- vs. prior month
- -4.1%
- Days on market
- 65
- Homes sold
- 130
- Homes for sale
- 519
- Months of supply (calculated)
- 4.0
Coconino County
$723,381
Median sale price, all home types
- vs. last year
- +11.5%
- vs. prior month
- +13.0%
- Days on market
- 71
- Homes sold
- 172
- Homes for sale
- 765
- Months of supply (calculated)
- 4.4
Gila County
$429,040
Median sale price, all home types
- vs. last year
- +2.2%
- vs. prior month
- -0.7%
- Days on market
- 93
- Homes sold
- 63
- Homes for sale
- 475
- Months of supply (calculated)
- 7.5
Graham County
$199,454
Median sale price, all home types (fewer than 10 sales)
- vs. last year
- -34.8%
- vs. prior month
- -54.1%
- Days on market
- 51
- Homes sold
- 5
- Homes for sale
- 91
- Months of supply (calculated)
- 18.2
Greenlee County
$263,750
Median asking price, all home types. Listing data: no closed sales were published for the latest month
- vs. last year
- -7.2%
- vs. prior month
- -25.1%
- Days listed
- 51
- Pending sales
- 1
- Homes for sale
- 10
- Months of supply (calculated from pending sales)
- 10.0
La Paz County
$409,085
Median sale price, all home types (fewer than 10 sales)
- vs. last year
- +5.6%
- vs. prior month
- +54.4%
- Days on market
- 142
- Homes sold
- 6
- Homes for sale
- 89
- Months of supply (calculated)
- 14.8
Maricopa County
$473,939
Median sale price, all home types
- vs. last year
- -2.7%
- vs. prior month
- +0.1%
- Days on market
- 67
- Homes sold
- 4,588
- Homes for sale
- 15,780
- Months of supply (calculated)
- 3.4
Mohave County
$338,243
Median sale price, all home types
- vs. last year
- +2.6%
- vs. prior month
- +4.9%
- Days on market
- 40
- Homes sold
- 310
- Homes for sale
- 1,527
- Months of supply (calculated)
- 4.9
Navajo County
$436,024
Median sale price, all home types
- vs. last year
- +8.3%
- vs. prior month
- +4.8%
- Days on market
- 93
- Homes sold
- 165
- Homes for sale
- 844
- Months of supply (calculated)
- 5.1
Pima County
$369,174
Median sale price, all home types
- vs. last year
- +2.5%
- vs. prior month
- +2.5%
- Days on market
- 69
- Homes sold
- 1,026
- Homes for sale
- 3,851
- Months of supply (calculated)
- 3.8
Pinal County
$371,514
Median sale price, all home types
- vs. last year
- -1.1%
- vs. prior month
- -2.2%
- Days on market
- 77
- Homes sold
- 749
- Homes for sale
- 2,657
- Months of supply (calculated)
- 3.5
Santa Cruz County
$334,701
Median sale price, all home types
- vs. last year
- +5.8%
- vs. prior month
- +16.6%
- Days on market
- 121
- Homes sold
- 37
- Homes for sale
- 284
- Months of supply (calculated)
- 7.7
Yavapai County
$505,613
Median sale price, all home types
- vs. last year
- +1.4%
- vs. prior month
- -2.8%
- Days on market
- 69
- Homes sold
- 415
- Homes for sale
- 1,814
- Months of supply (calculated)
- 4.4
Yuma County
$299,330
Median sale price, all home types
- vs. last year
- -4.0%
- vs. prior month
- +0.1%
- Days on market
- 82
- Homes sold
- 141
- Homes for sale
- 687
- Months of supply (calculated)
- 4.9
Arizona Market Reports by city: explore all 99 cities
Filter, sort, or tap Report for every town we track. This table is the same 99-city explorer as the homepage, framed for shoppers who want Arizona city market reports in one place.
City table for Arizona Market Reports (all home types)
Arizona real estate figures for all 99 cities and towns in our reports. City figures count all home types sold over the three months ending with the latest month, which steadies results in smaller towns. Where a town had no published sales, its row uses ZIP-level or county figures and is labeled under the town name. Type to filter, pick a region, or sort any column.
Showing 99 of 99 cities
| Region | Report link | ||||||
|---|---|---|---|---|---|---|---|
| Ahwatukee | $519,854 | -3.3% | -3.7% | 55 | 232 | Phoenix and Central Valley | Report |
| Anthem | $583,722 | -1.9% | -1.9% | 80 | 108 | Scottsdale and Northeast Valley | Report |
| Apache Junction | $415,909 | -3.3% | -0.8% | 42 | 194 | East Valley | Report |
| Avondale | $411,054 | -3.3% | -1.0% | 57 | 209 | West Valley | Report |
| Bisbee | $271,521 | -9.5% | -1.2% | 103 | 22 | Southeast Arizona | Report |
| Buckeye | $398,810 | -0.3% | -0.3% | 82 | 721 | West Valley | Report |
| Bullhead City | $305,854 | -1.3% | -1.3% | 61 | 226 | Colorado River and Mohave | Report |
| Camp Verde | $452,285 | -21.8% | -6.4% | 85 | 28 | Prescott and Verde Valley | Report |
| Carefree | $999,524 | -11.0% | -2.7% | 138 | 25 | Scottsdale and Northeast Valley | Report |
| Casa Grande | $324,296 | -0.2% | -0.2% | 66 | 193 | Pinal County | Report |
| Catalina Foothills | $689,169 | +1.8% | -2.2% | 76 | 224 | Tucson and Pima County | Report |
| Cave Creek | $1,212,423 | +18.1% | -0.4% | 110 | 25 | Scottsdale and Northeast Valley | Report |
| Chandler | $517,254 | -3.3% | -0.5% | 51 | 703 | East Valley | Report |
| Chino Valley | $449,286 | +7.0% | +1.6% | 57 | 77 | Prescott and Verde Valley | Report |
| Clarkdale | $524,750 | -4.6% | -0.0% | 58 | 21 | Prescott and Verde Valley | Report |
| Clifton*ZIP 85533 listing data: asking price, days listed, homes for sale | $314,500Asking price | +10.7% | -10.6% | 146 | 2 | Southeast Arizona | Report |
| Colorado CityZIP 86021 listing data: asking price, days listed, homes for sale | $506,500Asking price | -17.6% | -6.6% | 134 | 13 | Colorado River and Mohave | Report |
| Coolidge | $278,362 | -4.0% | -2.3% | 65 | 87 | Pinal County | Report |
| Cottonwood | $403,303 | +0.8% | +0.8% | 89 | 37 | Prescott and Verde Valley | Report |
| Dewey-Humboldt | $387,515 | +0.3% | -14.8% | 76 | 14 | Prescott and Verde Valley | Report |
| Douglas | $245,633 | +13.2% | +4.5% | 49 | 20 | Southeast Arizona | Report |
| El Mirage | $344,836 | -1.5% | -0.0% | 49 | 60 | West Valley | Report |
| Eloy | $383,717 | +36.3% | +16.0% | 82 | 51 | Pinal County | Report |
| Flagstaff | $739,148 | +2.7% | +5.3% | 43 | 230 | Flagstaff, Sedona and Northern Arizona | Report |
| Florence | $324,311 | -3.2% | -0.2% | 98 | 132 | Pinal County | Report |
| Fountain Hills | $699,667 | +4.4% | -3.5% | 68 | 125 | Scottsdale and Northeast Valley | Report |
| Gila BendZIP 85337 listing data: asking price, days listed, homes for sale | $200,000Asking price | -37.3% | 0.0% | 82 | 23 | West Valley | Report |
| Gilbert | $584,722 | +2.6% | -1.8% | 57 | 831 | East Valley | Report |
| Glendale | $424,798 | -2.3% | -2.3% | 63 | 573 | West Valley | Report |
| Globe* | $207,901 | +15.5% | -11.5% | 49 | 9 | Rim Country, Globe and White Mountains | Report |
| Gold Canyon | $469,526 | -1.2% | -5.9% | 106 | 77 | East Valley | Report |
| Goodyear | $472,970 | +0.6% | -0.6% | 75 | 521 | West Valley | Report |
| GuadalupeZIP 85283 data (shared with Tempe) | $483,108 | +2.8% | +3.9% | 52 | 90 | Phoenix and Central Valley | Report |
| Hayden*ZIP 85135 listing data: asking price, days listed, homes for sale | $95,000Asking price | +100.0% | -2.1% | 84 | 4 | Rim Country, Globe and White Mountains | Report |
| Holbrook* | $253,879 | +27.0% | +1.6% | 71 | 6 | Flagstaff, Sedona and Northern Arizona | Report |
| Huachuca City* | $202,404 | +3.3% | +1.2% | 82 | 6 | Southeast Arizona | Report |
| Jerome*ZIP 86331 listing data: asking price, days listed, homes for sale | $643,000Asking price | +51.3% | +29.9% | 79 | 4 | Prescott and Verde Valley | Report |
| Kearny* | $124,941 | -36.6% | -13.7% | 79 | 7 | Pinal County | Report |
| Lake Havasu City | $441,040 | -6.2% | -4.6% | 37 | 355 | Colorado River and Mohave | Report |
| Litchfield Park | $593,467 | +9.5% | -25.4% | 60 | 26 | West Valley | Report |
| Mammoth*ZIP 85618 listing data: asking price, days listed, homes for sale | $213,000Asking price | +39.7% | +3.9% | 104 | 3 | Pinal County | Report |
| Marana | $434,693 | +7.3% | -0.1% | 75 | 387 | Tucson and Pima County | Report |
| Maricopa | $344,836 | -0.6% | -0.5% | 82 | 367 | Pinal County | Report |
| Mayer* | $391,813 | +26.4% | +99.6% | 365 | 2 | Prescott and Verde Valley | Report |
| Mesa | $454,733 | -1.1% | +1.1% | 54 | 1,318 | East Valley | Report |
| Miami* | $249,881 | +83.1% | -0.0% | 416 | 1 | Rim Country, Globe and White Mountains | Report |
| Morristown*ZIP 85342 data | $289,915 | -44.5% | -16.0% | 75 | 5 | West Valley | Report |
| New River | $769,633 | -11.5% | -10.5% | 92 | 63 | Scottsdale and Northeast Valley | Report |
| Nogales | $224,893 | -9.0% | +9.7% | 68 | 13 | Southeast Arizona | Report |
| Oak Creek Canyon* | $1,061,994 | -32.5% | +5.9% | 40 | 2 | Flagstaff, Sedona and Northern Arizona | Report |
| Oatman*ZIP 86433 listing data: asking price, days listed, homes for sale | $325,000Asking price | -35.0% | -49.0% | 340 | 1 | Colorado River and Mohave | Report |
| Oro Valley | $524,750 | -1.0% | +2.4% | 82 | 236 | Tucson and Pima County | Report |
| Page*ZIP 86040 data | $432,373 | -16.4% | -3.9% | 33 | 2 | Flagstaff, Sedona and Northern Arizona | Report |
| Paradise Valley | $4,497,858 | +7.5% | +4.6% | 96 | 65 | Scottsdale and Northeast Valley | Report |
| Parker* | $262,375 | -20.5% | -0.0% | 30 | 3 | Colorado River and Mohave | Report |
| Parker StripZIP 85344 data (shared with Parker) | $294,913 | -10.6% | -35.1% | 102 | 14 | Colorado River and Mohave | Report |
| Patagonia*ZIP 85624 data | $406,880 | -31.0% | +53.5% | 80 | 3 | Southeast Arizona | Report |
| Payson | $499,762 | +12.3% | 0.0% | 72 | 84 | Rim Country, Globe and White Mountains | Report |
| Peoria | $509,757 | +1.4% | -0.0% | 67 | 667 | West Valley | Report |
| Phoenix | $452,285 | +0.5% | -0.6% | 60 | 3,810 | Phoenix and Central Valley | Report |
| Pinetop-Lakeside | $476,773 | +8.4% | -8.3% | 64 | 55 | Rim Country, Globe and White Mountains | Report |
| Prescott | $599,165 | +0.7% | -3.4% | 66 | 308 | Prescott and Verde Valley | Report |
| Prescott Valley | $458,782 | +3.1% | +0.9% | 65 | 286 | Prescott and Verde Valley | Report |
| Queen Creek | $640,694 | +1.9% | +0.6% | 82 | 336 | East Valley | Report |
| Safford* | $284,864 | +6.5% | -0.0% | 33 | 5 | Southeast Arizona | Report |
| Sahuarita | $345,735 | +2.2% | +1.7% | 67 | 188 | Tucson and Pima County | Report |
| San Luis | $255,878 | -2.7% | +0.3% | 136 | 63 | Yuma Area | Report |
| San Tan Valley | $424,973 | +1.0% | -0.7% | 78 | 647 | Pinal County | Report |
| Scottsdale | $889,576 | +9.2% | -1.7% | 82 | 1,208 | Scottsdale and Northeast Valley | Report |
| Sedona | $1,079,486 | -0.3% | +5.6% | 60 | 63 | Flagstaff, Sedona and Northern Arizona | Report |
| Show Low | $488,767 | -7.3% | +0.8% | 90 | 122 | Rim Country, Globe and White Mountains | Report |
| Sierra Vista | $314,850 | +5.5% | -0.0% | 55 | 181 | Southeast Arizona | Report |
| Snowflake | $383,267 | +21.7% | -16.2% | 55 | 14 | Rim Country, Globe and White Mountains | Report |
| Somerton | $273,870 | -1.3% | +0.7% | 56 | 19 | Yuma Area | Report |
| Springerville* | $234,888 | -4.1% | -0.0% | 52 | 7 | Rim Country, Globe and White Mountains | Report |
| St. Johns* | $199,905 | -7.0% | -0.0% | 49 | 6 | Rim Country, Globe and White Mountains | Report |
| Star Valley* | $507,758 | -8.9% | -10.8% | 13 | 3 | Rim Country, Globe and White Mountains | Report |
| Sun City | $259,876 | -1.9% | +0.4% | 82 | 316 | West Valley | Report |
| Sun City West | $349,833 | -3.6% | -0.0% | 69 | 193 | West Valley | Report |
| Sun Lakes | $459,781 | -2.7% | -4.2% | 62 | 115 | East Valley | Report |
| Superior* | $176,916 | +7.2% | -34.5% | 81 | 2 | Pinal County | Report |
| Surprise | $424,798 | +0.9% | +0.2% | 78 | 946 | West Valley | Report |
| Taylor* | $379,819 | -12.7% | -0.0% | 76 | 9 | Rim Country, Globe and White Mountains | Report |
| Tempe | $474,274 | +0.9% | +0.9% | 54 | 325 | East Valley | Report |
| Thatcher* | $199,805 | -49.9% | -52.3% | 58 | 1 | Southeast Arizona | Report |
| Tolleson* | $381,318 | +3.1% | +13.0% | 39 | 8 | Phoenix and Central Valley | Report |
| Tombstone* | $233,889 | +6.3% | -25.6% | 122 | 6 | Southeast Arizona | Report |
| Tucson | $315,850 | -1.3% | -1.3% | 66 | 1,152 | Tucson and Pima County | Report |
| TusayanCoconino County data | $723,381 | +11.5% | +13.0% | 71 | 172 | Flagstaff, Sedona and Northern Arizona | Report |
| Village of Oak Creek | $782,627 | +2.6% | +2.0% | 69 | 58 | Flagstaff, Sedona and Northern Arizona | Report |
| Wellton* | $315,850 | +9.1% | +1.6% | 176 | 7 | Yuma Area | Report |
| Wickenburg | $386,687 | +3.1% | -2.9% | 145 | 48 | West Valley | Report |
| Willcox* | $170,919 | +0.5% | -0.0% | 125 | 4 | Southeast Arizona | Report |
| Williams | $554,736 | +5.5% | -8.9% | 56 | 18 | Flagstaff, Sedona and Northern Arizona | Report |
| Winkelman*ZIP 85192 listing data: asking price, days listed, homes for sale | $176,725Asking price | -69.4% | -9.4% | 91 | 2 | Rim Country, Globe and White Mountains | Report |
| Winslow* | $275,079 | +29.8% | -8.3% | 57 | 9 | Flagstaff, Sedona and Northern Arizona | Report |
| Yarnell* | $233,889 | -37.0% | +17.5% | 28 | 3 | Prescott and Verde Valley | Report |
| Youngtown | $304,855 | -12.9% | -12.9% | 55 | 21 | West Valley | Report |
| Yuma | $307,853 | -2.3% | -3.8% | 63 | 239 | Yuma Area | Report |
No city matches. Try the county grid below or clear the filter.
* Fewer than 10 sales or listings in the period, so the figures can swing widely. Change vs. prior month compares the three-month median ending in the latest month with the one ending a month earlier.
Rows marked “Asking price” use Arizona real estate listings, always sort after the sale-price rows, and show the ZIP code’s median asking price and its changes, median days listed and homes for sale. Neighborhood Arizona real estate reports for Phoenix, Scottsdale and Tucson are linked from those city pages.
Using Arizona Market Reports as a buyer or seller
Arizona Market Reports help you shortlist areas before you tour homes or condos. Keep this hub open while you compare two towns, then open each full page from the Report link.
Buyers should treat this hub as a map, not a bid script. Compare two or three city pages near your price range, then confirm the county picture. Pair the data with loan path options, a dedicated full-time buyer’s agent, and a condo buyer guide when you want a home or condo rather than land or commercial.
Sellers can use the same monthly Arizona market data to see whether nearby medians rose or fell, then request a home value review based on recent local sales before pricing a listing with a dedicated full-time listing agent.
New-build shoppers should also open the new construction subdivisions hub after checking the city row here, because builder incentives change on a different calendar than closed-sales reports.
If you are relocating, skim several Arizona city market reports in the explorer, then read Arizona county market reports for the metros you are still considering. That sequence pairs well with our moving to Arizona guide.

Arizona Market Reports FAQ
What are Arizona Market Reports?
They are our monthly pages covering the Arizona homes and condos market statewide. This hub links every city and county report and shows the same all-home-types figures used on the homepage for October 2026.
How do city reports differ from county reports?
A city page covers one town, usually over the latest three months so small towns stay readable. A county page covers every home type sold in that county in the latest month. Start with the city if you know the town; use the county when you compare a wider area.
What is the median home price in Maricopa County?
The median sale price for all home types in Maricopa County is $473,939, -2.7% vs. a year earlier, in our October 2026 release.
What is the median home price in Phoenix?
Phoenix shows a median sale price of $452,285 for all home types over the latest three months, +0.5% vs. a year earlier, with a median of 60 days on market.
Which Arizona county has the highest median sale price?
Coconino County has the highest county median sale price at $723,381. Graham County has the lowest at $199,454, on 5 sales.
How many Arizona cities does this hub cover?
Arizona Market Reports cover 99 cities and towns and all 15 counties. Every row and card links to the full report.
How often is the data updated?
This hub and the linked pages refresh every month. Figures here count all home types, so condos and townhomes are included with single-family houses. Linked city and county pages focus on single-family homes, so their tables can differ.
How should buyers use this hub before touring?
Pick two or three city pages near your budget, compare days on market and change vs. last year, then read the matching county page for the wider supply picture. When you are ready, work with a dedicated full-time buyer’s agent.
How we build Arizona Market Reports
Every figure in these Arizona Market Reports counts all home types sold, including single-family houses, condos and townhomes. County figures cover the latest month. City and town figures cover the three months ending with the latest month. Homes for sale counts active listings during the month, and change vs. prior month compares the latest two published medians. Months of supply on county cards is calculated from public listing and sales counts for the same month.
Where no sales were published for a town, its row uses figures for its ZIP code or its county, labeled under the town name. Each value is checked by a script against its data file before publishing, and no figure is estimated. Linked Arizona city market reports and Arizona county market reports on this site focus on single-family homes, so their detail tables can differ from this hub’s all-home-types view.
Start with the Phoenix market report, the Maricopa County report, the new construction hub, or moving to Arizona.
Ask about Arizona Market Reports
Buying or selling a home or condo: tell us the city and property type, and a dedicated full-time local agent who works that Arizona homes and condos market will reach out.
Ask about a city or county report
Tell us the city and whether you want homes or condos. A dedicated full-time local agent follows up the way you prefer, and there is no cost to ask.
Do you know anyone looking to buy or sell real estate in Arizona? Share our website with them so they are fully informed.
Call Arizona Homes and Condos Realty at (480) 490-4865 or visit ArizonaHomesandCondos.com.