
99 cities · 15 counties · monthly data
Arizona Real Estate Market Data, City by City
Median prices, days on market and trends for Arizona homes for sale and Arizona condos for sale, from our own Arizona real estate reports.
Buying, selling or renting out in Arizona?
One message reaches a full-time dedicated agent who works your area.
Or call (480) 490-4865
A personal reply, usually the same business day. No auto-drips.
October 2026 Arizona real estate market snapshot
Last Updated: October 2026
- Maricopa County$473,939Median sale price, all home types-2.7% vs. last year+0.1% vs. prior month67 days on market · 4,588 homes sold · 15,780 homes for sale
- Pima County$369,174Median sale price, all home types+2.5% vs. last year+2.5% vs. prior month69 days on market · 1,026 homes sold · 3,851 homes for sale
- Pinal County$371,514Median sale price, all home types-1.1% vs. last year-2.2% vs. prior month77 days on market · 749 homes sold · 2,657 homes for sale
- Yavapai County$505,613Median sale price, all home types+1.4% vs. last year-2.8% vs. prior month69 days on market · 415 homes sold · 1,814 homes for sale
- Coconino County$723,381Median sale price, all home types+11.5% vs. last year+13.0% vs. prior month71 days on market · 172 homes sold · 765 homes for sale
These Arizona real estate figures count all home types sold in each county in the latest month, including single-family houses, condos and townhomes. Homes for sale counts active listings during the month. Tap a county for its full report, which focuses on single-family homes.
Arizona real estate key facts
Quotable Arizona real estate figures from our October 2026 reports. Each one links back to a county or city page with the full table, so you can cite the source report for Arizona homes for sale in that area.
Key factMaricopa County’s median sale price for all home types was $473,939, -2.7% vs. a year earlier, on 4,588 homes sold.
Key factCoconino County had the highest county median we publish at $723,381; Graham County was the lowest at $199,454 on 5 sales.
Key factOf the 99 cities and towns in the explorer, 49 show a higher median price than a year earlier and 50 a lower one.
Key fact15,780 homes were for sale in Maricopa County, and the median home sold after 67 days on market.
Arizona homes for sale: explore 99 cities
Median prices for Arizona homes for sale and Arizona condos for sale, by city
Arizona real estate figures for all 99 cities and towns in our reports. City figures count all home types sold over the three months ending with the latest month, which steadies results in smaller towns. Where a town had no published sales, its row uses ZIP-level or county figures and is labeled under the town name. Type to filter, pick a region, or sort any column.
Showing 99 of 99 cities
| Region | Report link | ||||||
|---|---|---|---|---|---|---|---|
| Ahwatukee | $519,854 | -3.3% | -3.7% | 55 | 232 | Phoenix and Central Valley | Report |
| Anthem | $583,722 | -1.9% | -1.9% | 80 | 108 | Scottsdale and Northeast Valley | Report |
| Apache Junction | $415,909 | -3.3% | -0.8% | 42 | 194 | East Valley | Report |
| Avondale | $411,054 | -3.3% | -1.0% | 57 | 209 | West Valley | Report |
| Bisbee | $271,521 | -9.5% | -1.2% | 103 | 22 | Southeast Arizona | Report |
| Buckeye | $398,810 | -0.3% | -0.3% | 82 | 721 | West Valley | Report |
| Bullhead City | $305,854 | -1.3% | -1.3% | 61 | 226 | Colorado River and Mohave | Report |
| Camp Verde | $452,285 | -21.8% | -6.4% | 85 | 28 | Prescott and Verde Valley | Report |
| Carefree | $999,524 | -11.0% | -2.7% | 138 | 25 | Scottsdale and Northeast Valley | Report |
| Casa Grande | $324,296 | -0.2% | -0.2% | 66 | 193 | Pinal County | Report |
| Catalina Foothills | $689,169 | +1.8% | -2.2% | 76 | 224 | Tucson and Pima County | Report |
| Cave Creek | $1,212,423 | +18.1% | -0.4% | 110 | 25 | Scottsdale and Northeast Valley | Report |
| Chandler | $517,254 | -3.3% | -0.5% | 51 | 703 | East Valley | Report |
| Chino Valley | $449,286 | +7.0% | +1.6% | 57 | 77 | Prescott and Verde Valley | Report |
| Clarkdale | $524,750 | -4.6% | -0.0% | 58 | 21 | Prescott and Verde Valley | Report |
| Clifton*† | $314,500Asking price | +10.7% | -10.6% | 146 | 2 | Southeast Arizona | Report |
| Colorado City† | $506,500Asking price | -17.6% | -6.6% | 134 | 13 | Colorado River and Mohave | Report |
| Coolidge | $278,362 | -4.0% | -2.3% | 65 | 87 | Pinal County | Report |
| Cottonwood | $403,303 | +0.8% | +0.8% | 89 | 37 | Prescott and Verde Valley | Report |
| Dewey-Humboldt | $387,515 | +0.3% | -14.8% | 76 | 14 | Prescott and Verde Valley | Report |
| Douglas | $245,633 | +13.2% | +4.5% | 49 | 20 | Southeast Arizona | Report |
| El Mirage | $344,836 | -1.5% | -0.0% | 49 | 60 | West Valley | Report |
| Eloy | $383,717 | +36.3% | +16.0% | 82 | 51 | Pinal County | Report |
| Flagstaff | $739,148 | +2.7% | +5.3% | 43 | 230 | Flagstaff, Sedona and Northern Arizona | Report |
| Florence | $324,311 | -3.2% | -0.2% | 98 | 132 | Pinal County | Report |
| Fountain Hills | $699,667 | +4.4% | -3.5% | 68 | 125 | Scottsdale and Northeast Valley | Report |
| Gila Bend† | $200,000Asking price | -37.3% | 0.0% | 82 | 23 | West Valley | Report |
| Gilbert | $584,722 | +2.6% | -1.8% | 57 | 831 | East Valley | Report |
| Glendale | $424,798 | -2.3% | -2.3% | 63 | 573 | West Valley | Report |
| Globe* | $207,901 | +15.5% | -11.5% | 49 | 9 | Rim Country, Globe and White Mountains | Report |
| Gold Canyon | $469,526 | -1.2% | -5.9% | 106 | 77 | East Valley | Report |
| Goodyear | $472,970 | +0.6% | -0.6% | 75 | 521 | West Valley | Report |
| Guadalupe‡ | $483,108 | +2.8% | +3.9% | 52 | 90 | Phoenix and Central Valley | Report |
| Hayden*† | $95,000Asking price | +100.0% | -2.1% | 84 | 4 | Rim Country, Globe and White Mountains | Report |
| Holbrook* | $253,879 | +27.0% | +1.6% | 71 | 6 | Flagstaff, Sedona and Northern Arizona | Report |
| Huachuca City* | $202,404 | +3.3% | +1.2% | 82 | 6 | Southeast Arizona | Report |
| Jerome*† | $643,000Asking price | +51.3% | +29.9% | 79 | 4 | Prescott and Verde Valley | Report |
| Kearny* | $124,941 | -36.6% | -13.7% | 79 | 7 | Pinal County | Report |
| Lake Havasu City | $441,040 | -6.2% | -4.6% | 37 | 355 | Colorado River and Mohave | Report |
| Litchfield Park | $593,467 | +9.5% | -25.4% | 60 | 26 | West Valley | Report |
| Mammoth*† | $213,000Asking price | +39.7% | +3.9% | 104 | 3 | Pinal County | Report |
| Marana | $434,693 | +7.3% | -0.1% | 75 | 387 | Tucson and Pima County | Report |
| Maricopa | $344,836 | -0.6% | -0.5% | 82 | 367 | Pinal County | Report |
| Mayer* | $391,813 | +26.4% | +99.6% | 365 | 2 | Prescott and Verde Valley | Report |
| Mesa | $454,733 | -1.1% | +1.1% | 54 | 1,318 | East Valley | Report |
| Miami* | $249,881 | +83.1% | -0.0% | 416 | 1 | Rim Country, Globe and White Mountains | Report |
| Morristown*‡ | $289,915 | -44.5% | -16.0% | 75 | 5 | West Valley | Report |
| New River | $769,633 | -11.5% | -10.5% | 92 | 63 | Scottsdale and Northeast Valley | Report |
| Nogales | $224,893 | -9.0% | +9.7% | 68 | 13 | Southeast Arizona | Report |
| Oak Creek Canyon* | $1,061,994 | -32.5% | +5.9% | 40 | 2 | Flagstaff, Sedona and Northern Arizona | Report |
| Oatman*† | $325,000Asking price | -35.0% | -49.0% | 340 | 1 | Colorado River and Mohave | Report |
| Oro Valley | $524,750 | -1.0% | +2.4% | 82 | 236 | Tucson and Pima County | Report |
| Page*‡ | $432,373 | -16.4% | -3.9% | 33 | 2 | Flagstaff, Sedona and Northern Arizona | Report |
| Paradise Valley | $4,497,858 | +7.5% | +4.6% | 96 | 65 | Scottsdale and Northeast Valley | Report |
| Parker* | $262,375 | -20.5% | -0.0% | 30 | 3 | Colorado River and Mohave | Report |
| Parker Strip‡ | $294,913 | -10.6% | -35.1% | 102 | 14 | Colorado River and Mohave | Report |
| Patagonia*‡ | $406,880 | -31.0% | +53.5% | 80 | 3 | Southeast Arizona | Report |
| Payson | $499,762 | +12.3% | 0.0% | 72 | 84 | Rim Country, Globe and White Mountains | Report |
| Peoria | $509,757 | +1.4% | -0.0% | 67 | 667 | West Valley | Report |
| Phoenix | $452,285 | +0.5% | -0.6% | 60 | 3,810 | Phoenix and Central Valley | Report |
| Pinetop-Lakeside | $476,773 | +8.4% | -8.3% | 64 | 55 | Rim Country, Globe and White Mountains | Report |
| Prescott | $599,165 | +0.7% | -3.4% | 66 | 308 | Prescott and Verde Valley | Report |
| Prescott Valley | $458,782 | +3.1% | +0.9% | 65 | 286 | Prescott and Verde Valley | Report |
| Queen Creek | $640,694 | +1.9% | +0.6% | 82 | 336 | East Valley | Report |
| Safford* | $284,864 | +6.5% | -0.0% | 33 | 5 | Southeast Arizona | Report |
| Sahuarita | $345,735 | +2.2% | +1.7% | 67 | 188 | Tucson and Pima County | Report |
| San Luis | $255,878 | -2.7% | +0.3% | 136 | 63 | Yuma Area | Report |
| San Tan Valley | $424,973 | +1.0% | -0.7% | 78 | 647 | Pinal County | Report |
| Scottsdale | $889,576 | +9.2% | -1.7% | 82 | 1,208 | Scottsdale and Northeast Valley | Report |
| Sedona | $1,079,486 | -0.3% | +5.6% | 60 | 63 | Flagstaff, Sedona and Northern Arizona | Report |
| Show Low | $488,767 | -7.3% | +0.8% | 90 | 122 | Rim Country, Globe and White Mountains | Report |
| Sierra Vista | $314,850 | +5.5% | -0.0% | 55 | 181 | Southeast Arizona | Report |
| Snowflake | $383,267 | +21.7% | -16.2% | 55 | 14 | Rim Country, Globe and White Mountains | Report |
| Somerton | $273,870 | -1.3% | +0.7% | 56 | 19 | Yuma Area | Report |
| Springerville* | $234,888 | -4.1% | -0.0% | 52 | 7 | Rim Country, Globe and White Mountains | Report |
| St. Johns* | $199,905 | -7.0% | -0.0% | 49 | 6 | Rim Country, Globe and White Mountains | Report |
| Star Valley* | $507,758 | -8.9% | -10.8% | 13 | 3 | Rim Country, Globe and White Mountains | Report |
| Sun City | $259,876 | -1.9% | +0.4% | 82 | 316 | West Valley | Report |
| Sun City West | $349,833 | -3.6% | -0.0% | 69 | 193 | West Valley | Report |
| Sun Lakes | $459,781 | -2.7% | -4.2% | 62 | 115 | East Valley | Report |
| Superior* | $176,916 | +7.2% | -34.5% | 81 | 2 | Pinal County | Report |
| Surprise | $424,798 | +0.9% | +0.2% | 78 | 946 | West Valley | Report |
| Taylor* | $379,819 | -12.7% | -0.0% | 76 | 9 | Rim Country, Globe and White Mountains | Report |
| Tempe | $474,274 | +0.9% | +0.9% | 54 | 325 | East Valley | Report |
| Thatcher* | $199,805 | -49.9% | -52.3% | 58 | 1 | Southeast Arizona | Report |
| Tolleson* | $381,318 | +3.1% | +13.0% | 39 | 8 | Phoenix and Central Valley | Report |
| Tombstone* | $233,889 | +6.3% | -25.6% | 122 | 6 | Southeast Arizona | Report |
| Tucson | $315,850 | -1.3% | -1.3% | 66 | 1,152 | Tucson and Pima County | Report |
| Tusayan‡ | $723,381 | +11.5% | +13.0% | 71 | 172 | Flagstaff, Sedona and Northern Arizona | Report |
| Village of Oak Creek | $782,627 | +2.6% | +2.0% | 69 | 58 | Flagstaff, Sedona and Northern Arizona | Report |
| Wellton* | $315,850 | +9.1% | +1.6% | 176 | 7 | Yuma Area | Report |
| Wickenburg | $386,687 | +3.1% | -2.9% | 145 | 48 | West Valley | Report |
| Willcox* | $170,919 | +0.5% | -0.0% | 125 | 4 | Southeast Arizona | Report |
| Williams | $554,736 | +5.5% | -8.9% | 56 | 18 | Flagstaff, Sedona and Northern Arizona | Report |
| Winkelman*† | $176,725Asking price | -69.4% | -9.4% | 91 | 2 | Rim Country, Globe and White Mountains | Report |
| Winslow* | $275,079 | +29.8% | -8.3% | 57 | 9 | Flagstaff, Sedona and Northern Arizona | Report |
| Yarnell* | $233,889 | -37.0% | +17.5% | 28 | 3 | Prescott and Verde Valley | Report |
| Youngtown | $304,855 | -12.9% | -12.9% | 55 | 21 | West Valley | Report |
| Yuma | $307,853 | -2.3% | -3.8% | 63 | 239 | Yuma Area | Report |
No city matches. Try the county grid below or clear the filter.
† Small markets with few closings use ZIP-level asking-price data. ‡ Small markets shown with ZIP- or county-level sales data.
* Fewer than 10 sales or listings in the period, so the figures can swing widely. Change vs. prior month compares the three-month median ending in the latest month with the one ending a month earlier.
Rows marked “Asking price” use Arizona real estate listings, always sort after the sale-price rows, and show the ZIP code’s median asking price and its changes, median days listed and homes for sale. Neighborhood Arizona real estate reports for Phoenix, Scottsdale and Tucson are linked from those city pages.
Arizona real estate by county: all 15 counties
Arizona real estate figures for all 15 counties. Figures count all home types sold in each county in the latest month; homes for sale counts active listings during the month. Greenlee County had no published closed sales, so its card shows listing data and says so. Months of supply (calculated: active listings divided by monthly sales) uses each county’s latest-month figures; for Greenlee County it divides active listings by pending sales.
Apache County
$332,256
Median sale price, all home types
- vs. last year
- -5.1%
- vs. prior month
- +9.1%
- Days on market
- 80
- Homes sold
- 28
- Homes for sale
- 204
- Months of supply (calculated)
- 7.3
Cochise County
$282,867
Median sale price, all home types
- vs. last year
- -4.8%
- vs. prior month
- -4.1%
- Days on market
- 65
- Homes sold
- 130
- Homes for sale
- 519
- Months of supply (calculated)
- 4.0
Coconino County
$723,381
Median sale price, all home types
- vs. last year
- +11.5%
- vs. prior month
- +13.0%
- Days on market
- 71
- Homes sold
- 172
- Homes for sale
- 765
- Months of supply (calculated)
- 4.4
Gila County
$429,040
Median sale price, all home types
- vs. last year
- +2.2%
- vs. prior month
- -0.7%
- Days on market
- 93
- Homes sold
- 63
- Homes for sale
- 475
- Months of supply (calculated)
- 7.5
Graham County
$199,454
Median sale price, all home types (fewer than 10 sales)
- vs. last year
- -34.8%
- vs. prior month
- -54.1%
- Days on market
- 51
- Homes sold
- 5
- Homes for sale
- 91
- Months of supply (calculated)
- 18.2
Greenlee County
$263,750
Median asking price, all home types. Listing data: no closed sales were published for the latest month
- vs. last year
- -7.2%
- vs. prior month
- -25.1%
- Days listed
- 51
- Pending sales
- 1
- Homes for sale
- 10
- Months of supply (calculated from pending sales)
- 10.0
La Paz County
$409,085
Median sale price, all home types (fewer than 10 sales)
- vs. last year
- +5.6%
- vs. prior month
- +54.4%
- Days on market
- 142
- Homes sold
- 6
- Homes for sale
- 89
- Months of supply (calculated)
- 14.8
Maricopa County
$473,939
Median sale price, all home types
- vs. last year
- -2.7%
- vs. prior month
- +0.1%
- Days on market
- 67
- Homes sold
- 4,588
- Homes for sale
- 15,780
- Months of supply (calculated)
- 3.4
Mohave County
$338,243
Median sale price, all home types
- vs. last year
- +2.6%
- vs. prior month
- +4.9%
- Days on market
- 40
- Homes sold
- 310
- Homes for sale
- 1,527
- Months of supply (calculated)
- 4.9
Navajo County
$436,024
Median sale price, all home types
- vs. last year
- +8.3%
- vs. prior month
- +4.8%
- Days on market
- 93
- Homes sold
- 165
- Homes for sale
- 844
- Months of supply (calculated)
- 5.1
Pima County
$369,174
Median sale price, all home types
- vs. last year
- +2.5%
- vs. prior month
- +2.5%
- Days on market
- 69
- Homes sold
- 1,026
- Homes for sale
- 3,851
- Months of supply (calculated)
- 3.8
Pinal County
$371,514
Median sale price, all home types
- vs. last year
- -1.1%
- vs. prior month
- -2.2%
- Days on market
- 77
- Homes sold
- 749
- Homes for sale
- 2,657
- Months of supply (calculated)
- 3.5
Santa Cruz County
$334,701
Median sale price, all home types
- vs. last year
- +5.8%
- vs. prior month
- +16.6%
- Days on market
- 121
- Homes sold
- 37
- Homes for sale
- 284
- Months of supply (calculated)
- 7.7
Yavapai County
$505,613
Median sale price, all home types
- vs. last year
- +1.4%
- vs. prior month
- -2.8%
- Days on market
- 69
- Homes sold
- 415
- Homes for sale
- 1,814
- Months of supply (calculated)
- 4.4
Yuma County
$299,330
Median sale price, all home types
- vs. last year
- -4.0%
- vs. prior month
- +0.1%
- Days on market
- 82
- Homes sold
- 141
- Homes for sale
- 687
- Months of supply (calculated)
- 4.9
Arizona property management: $99 a month, flat
We manage homes and condos from $200,000 to $6 million.
Our property management fee is a flat $99 a month per property, not a percentage of rent. Here is how a flat fee compares with a percentage fee at the Census median gross rent for Phoenix, $1,582 a month.
At a $1,582 rent, the $99 flat fee is $330.72 a year less than a fee of 8% of rent, and $710.40 a year less than a fee of 10% of rent.
| City | Census median gross rent | At 8% | At 10% | Flat fee |
|---|---|---|---|---|
| Phoenix | $1,582 | $126.56 | $158.20 | $99 |
| Mesa | $1,620 | $129.60 | $162.00 | $99 |
| Scottsdale | $2,013 | $161.04 | $201.30 | $99 |
Median gross rent: U.S. Census Bureau, 2020-2024 American Community Survey 5-year estimates, Table B25064 (each city name links to its official table). The 8% and 10% figures are illustrative math, not quoted rates from any company; percentage fees vary. Monthly fee per property.
Free Rental AnalysisProperty management by city
- Phoenix
- Mesa
- Gilbert
- Chandler
- Glendale
- Scottsdale
- Tempe
- Peoria
- Surprise
- San Tan Valley
- Goodyear
- Buckeye
- Avondale
- Ahwatukee (Phoenix)
- Queen Creek
- City of Maricopa
- Apache Junction
- El Mirage
- Sun City
- Sun City West
- Fountain Hills
- Anthem
- New River
- Sun Lakes
- Gold Canyon
- Paradise Valley
- Tolleson
- Youngtown
- Litchfield Park
- Guadalupe
- Citrus Park
- Cave Creek
- Carefree
Arizona mortgage calculator
Estimate your full monthly payment
Last Updated: November 3rd, 2026
For your home or condo in Arizona: Conventional, FHA, VA, USDA, Jumbo and Physician loans, with taxes, insurance, HOA dues and mortgage insurance. Pick a loan type to fill in its minimum down payment, then change any number. This is an estimate, not a loan offer.
Estimated monthly payment
Enter your rate
- Principal + interest
- Taxes
- Insurance
- Mortgage ins.
- HOA
How this calculator works and sources
FHA: 1.75% upfront premium on the base loan, plus an annual premium of 0.15% to 0.75% by loan size, down payment and term. VA: one-time funding fee of 1.25% to 3.3% by down payment and first or later use, waived when exempt; no monthly mortgage insurance. USDA: 1.00% upfront guarantee fee and 0.35% annual fee. Jumbo: a loan over the 2026 conforming limit of $832,750, which applies in every Arizona county. Monthly mortgage insurance shown is the first-year estimate. Physician loans: terms are typical, vary by lender, and have no official source: often 0% down up to $1,000,000, 5% down up to $1,500,000, about 10% down up to $2,000,000, and no PMI. Lenders set all rates and jumbo or physician terms.
- HUD Mortgagee Letter 2023-05: FHA upfront 1.75%, annual MIP table
- VA funding fee rates and exemptions (va.gov)
- USDA Rural Development guaranteed loan terms and fees, 0% down (rd.usda.gov)
- USDA Rural Development FY 2027 fee notice: 1.00% upfront, 0.35% annual
- FHFA 2026 conforming loan limits: $832,750 in every Arizona county
- FHFA 2026 county loan limit list (CSV)
- Fannie Mae Selling Guide B2-1.3-01: 97% LTV purchase needs a first-time buyer
- Fannie Mae Selling Guide B5-6-01: HomeReady 97% LTV and income limits
Rates checked November 3rd, 2026.
Arizona real estate tools and data sources
Free Arizona real estate tools and official data for comparing Arizona homes for sale and Arizona condos for sale. Condo buyers should also read the condo buyer guide, and every city report links its own neighborhoods.
Home value review
Request a price opinion for one address, based on recent nearby sales.
Our toolArizona mortgage calculator
Full payment math with FHA, VA and USDA options, taxes, insurance and HOA.
Our toolSun and shade map
See where the sun and shade fall on a yard, pool or roof at any hour and season.
Outside toolNew construction subdivisions
Subdivisions and builders by city, with the contract points to check.
Our tool1031 exchange guide
The 45-day and 180-day timelines and rules for trading investment property.
Our toolMultifamily data
Census housing data, HUD fair market rents and job figures for apartment buildings.
Our toolFHA loan guide
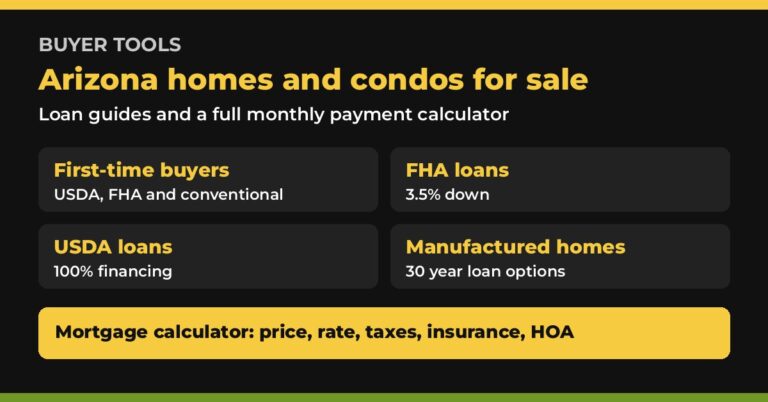
2026 FHA loan limits by Arizona county and the 3.5% down rules.
Our toolUSDA loan guide
Eligibility map, income limits and Arizona towns that qualify.
Our toolFirst-time buyer guide
USDA, FHA and 3% down conventional loans compared side by side.
Our toolManufactured home loans
FHA, Fannie Mae and Freddie Mac rules for manufactured homes.
Our toolSchool report cards
Arizona Department of Education letter grades and report cards by school.
Official sourceCrime data explorer
FBI Crime Data Explorer figures by police agency.
Official source

Arizona real estate FAQ
What is the median home price in Maricopa County?
The median sale price for all home types in Maricopa County is $473,939, -2.7% vs. a year earlier, in our October 2026 Arizona real estate data.
What is the median home price in Phoenix?
Phoenix Arizona real estate has a median sale price of $452,285 for all home types over the latest three months, +0.5% vs. a year earlier, with a median of 60 days on market.
Which Arizona county has the highest median sale price?
In our Arizona real estate data, Coconino County has the highest county median sale price at $723,381. Graham County has the lowest at $199,454, on 5 sales.
How long do Arizona homes and condos take to sell?
Median days on market range by county from 40 to 142 days. Maricopa County homes sold after a median of 67 days, Pima County 69 and Pinal County 77.
How many homes are for sale in Maricopa County?
15,780 homes were listed for sale in Maricopa County during the month, and 4,588 homes sold. In Pima County, 3,851 homes were listed and 1,026 sold.
How many Arizona cities do you track?
We publish a monthly report for 99 Arizona cities and towns and all 15 counties, and all of them have figures on this page. Where a town or county had no published sales, its row or card uses ZIP-level, county or listing figures and is labeled.
How often is this Arizona real estate data updated?
This page is refreshed monthly. Its figures count all home types, so Arizona condos for sale and townhomes are included with single-family houses. Our city and county reports focus on single-family homes, so their figures can differ.
How we build this Arizona real estate data
Every Arizona real estate figure on this page counts all home types sold, including single-family houses, condos and townhomes. County figures cover the latest month. City and town figures cover the three months ending with the latest month. Homes for sale counts active listings during the month, and change vs. prior month compares the latest two published medians. Months of supply is calculated: active listing counts divided by monthly closed-sales counts, both from public market data for the same month.
Where no sales were published for a town, its row uses figures for its ZIP code (sales, or asking prices from listings) or its county, labeled under the town name. Each value is checked by a script against its data file before publishing, and no figure is estimated. Our city and county reports focus on single-family homes, so their figures can differ from this page.
For more Arizona real estate detail, start with the Phoenix market report, the Maricopa County report, the new construction hub or moving to Arizona.


Ask about Arizona real estate
Buying, selling, renting out or investing: tell us where and what, and a local agent who works that Arizona real estate market will reach out.
Talk with a local Arizona real estate agent
Tell us the city and property type. A dedicated full-time local agent follows up the way you prefer, and there is no cost to ask.