
Arizona housing market by city, homes and condos
Buyer’s vs Seller’s Market by Arizona City (Homes and Condos): November 2026
Is your city a buyer’s market or a seller’s market right now? This Arizona housing market by city page rates 34 cities for homes and condos using months of supply, the same rule we use on every city report.
Arizona housing market by city key facts
- 30 of 34 cities are balanced for homes (3 to 6 months of supply).
- A buyer’s market for homes: Payson and Wickenburg. A seller’s market: Sun Lakes and Sun City West.
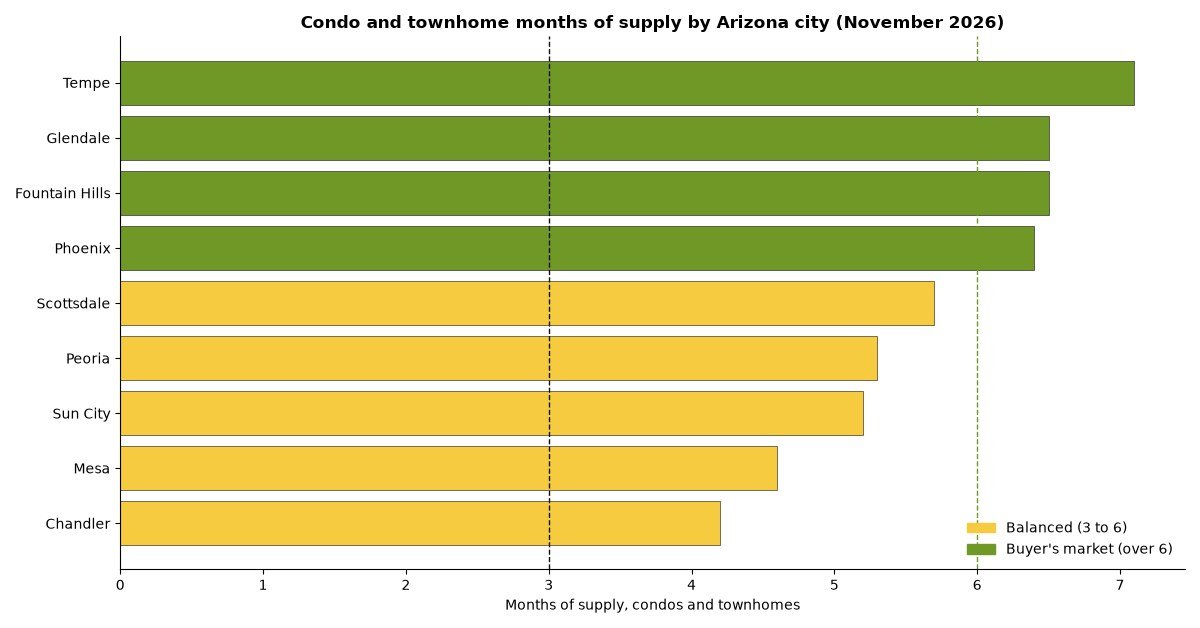
- Condos and townhomes are a buyer’s market in 4 of 9 rated cities, including Phoenix (6.4 months).
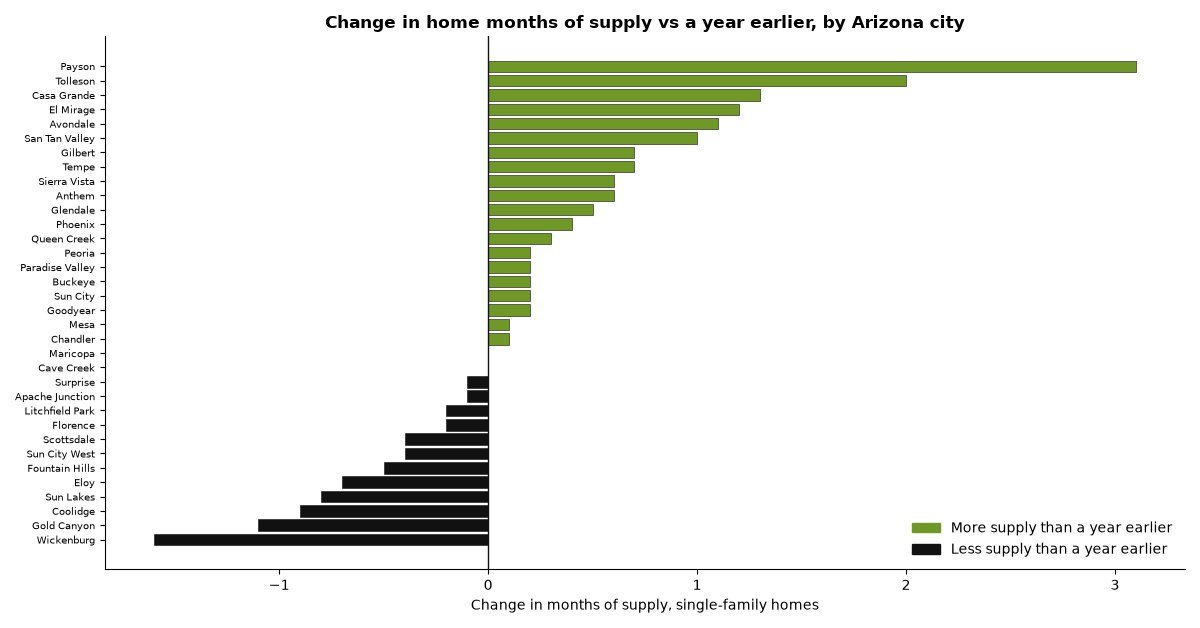
- Months of supply for homes rose from a year earlier in 20 cities.
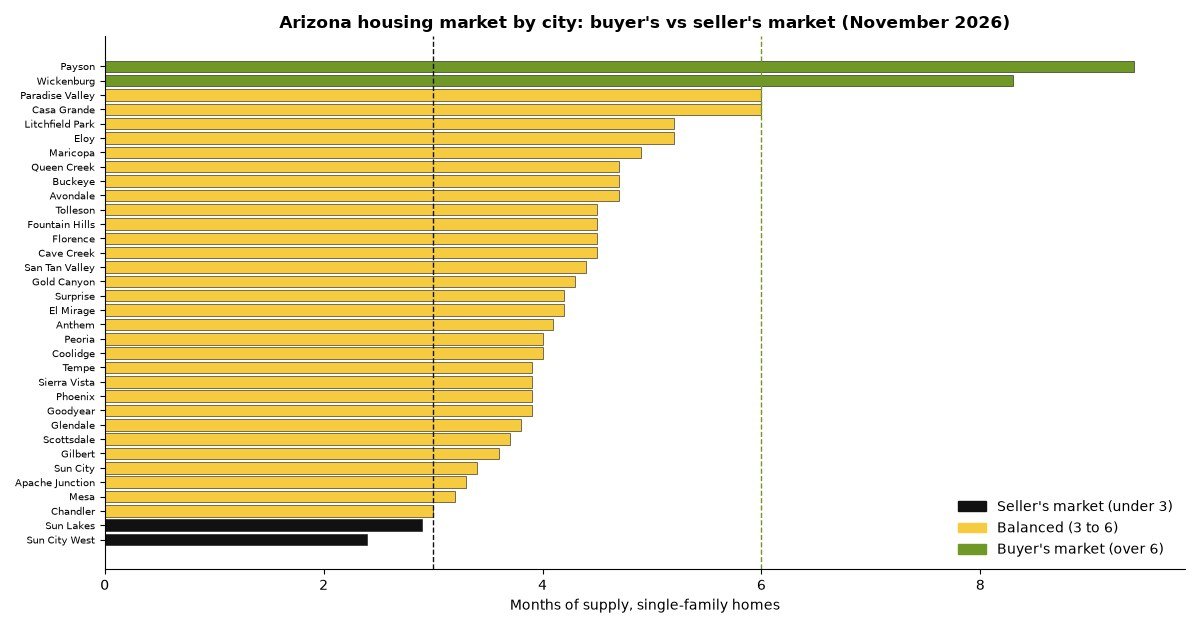
Arizona housing market by city: November 2026 verdict
This is our Arizona housing market by city scorecard for homes and condos. We rate 34 Arizona cities using one measure, months of supply, so you can see at a glance whether buyers or sellers have the upper hand where you plan to move.
Right now 30 of 34 cities are balanced for single-family homes, 2 are a buyer’s market (Payson and Wickenburg) and 2 are a seller’s market (Sun Lakes and Sun City West). Condos and townhomes lean further toward buyers: 4 of the 9 cities with enough condo sales to rate are a buyer’s market for condos and townhomes.
Supply runs from 2.4 months in Sun City West to 9.4 months in Payson. The City of Phoenix sits at 3.9 months for homes and 6.4 months for condos and townhomes, so Phoenix homes are balanced while Phoenix condos are a buyer’s market.
Buyer’s or seller’s market: every Arizona city we track
This Arizona housing market by city table is sorted from most supply (strongest for buyers) to least supply (strongest for sellers). Click a city for its full homes and condos market report.
| City | Homes: months of supply | Homes: market type | Homes: a year earlier (change) | Condos and townhomes: months of supply | Condos and townhomes: market type |
|---|---|---|---|---|---|
| Payson | 9.4 | Buyer’s market | 6.3 (+3.1) | Not rated this month | Ask us for comps |
| Wickenburg | 8.3 | Buyer’s market | 9.9 (-1.6) | Not rated this month | Ask us for comps |
| Casa Grande | 6.0 | Balanced | 4.7 (+1.3) | Not rated this month | Ask us for comps |
| Paradise Valley | 6.0 | Balanced | 5.8 (+0.2) | Not rated this month | Ask us for comps |
| Eloy | 5.2 | Balanced | 5.9 (-0.7) | Not rated this month | Ask us for comps |
| Litchfield Park | 5.2 | Balanced | 5.4 (-0.2) | Not rated this month | Ask us for comps |
| Maricopa | 4.9 | Balanced | 4.9 (+0.0) | Not rated this month | Ask us for comps |
| Avondale | 4.7 | Balanced | 3.6 (+1.1) | Not rated this month | Ask us for comps |
| Buckeye | 4.7 | Balanced | 4.5 (+0.2) | Not rated this month | Ask us for comps |
| Queen Creek | 4.7 | Balanced | 4.4 (+0.3) | Not rated this month | Ask us for comps |
| Cave Creek | 4.5 | Balanced | 4.5 (+0.0) | Not rated this month | Ask us for comps |
| Florence | 4.5 | Balanced | 4.7 (-0.2) | Not rated this month | Ask us for comps |
| Fountain Hills | 4.5 | Balanced | 5.0 (-0.5) | 6.5 | Buyer’s market |
| Tolleson | 4.5 | Balanced | 2.5 (+2.0) | Not rated this month | Ask us for comps |
| San Tan Valley | 4.4 | Balanced | 3.4 (+1.0) | Not rated this month | Ask us for comps |
| Gold Canyon | 4.3 | Balanced | 5.4 (-1.1) | Not rated this month | Ask us for comps |
| El Mirage | 4.2 | Balanced | 3.0 (+1.2) | Not rated this month | Ask us for comps |
| Surprise | 4.2 | Balanced | 4.3 (-0.1) | Not rated this month | Ask us for comps |
| Anthem | 4.1 | Balanced | 3.5 (+0.6) | Not rated this month | Ask us for comps |
| Coolidge | 4.0 | Balanced | 4.9 (-0.9) | Not rated this month | Ask us for comps |
| Peoria | 4.0 | Balanced | 3.8 (+0.2) | 5.3 | Balanced |
| Goodyear | 3.9 | Balanced | 3.7 (+0.2) | Not rated this month | Ask us for comps |
| Phoenix | 3.9 | Balanced | 3.5 (+0.4) | 6.4 | Buyer’s market |
| Sierra Vista | 3.9 | Balanced | 3.3 (+0.6) | Not rated this month | Ask us for comps |
| Tempe | 3.9 | Balanced | 3.2 (+0.7) | 7.1 | Buyer’s market |
| Glendale | 3.8 | Balanced | 3.3 (+0.5) | 6.5 | Buyer’s market |
| Scottsdale | 3.7 | Balanced | 4.1 (-0.4) | 5.7 | Balanced |
| Gilbert | 3.6 | Balanced | 2.9 (+0.7) | Not rated this month | Ask us for comps |
| Sun City | 3.4 | Balanced | 3.2 (+0.2) | 5.2 | Balanced |
| Apache Junction | 3.3 | Balanced | 3.4 (-0.1) | Not rated this month | Ask us for comps |
| Mesa | 3.2 | Balanced | 3.1 (+0.1) | 4.6 | Balanced |
| Chandler | 3.0 | Balanced | 2.9 (+0.1) | 4.2 | Balanced |
| Sun Lakes | 2.9 | Seller’s market | 3.7 (-0.8) | Not rated this month | Ask us for comps |
| Sun City West | 2.4 | Seller’s market | 2.8 (-0.4) | Not rated this month | Ask us for comps |
Condo and townhome ratings appear only where at least 10 condos and townhomes closed in the latest month. Below that, or where the condo figure is not reported, a few sales can swing the number, so we give you comps instead of a label. This keeps the Arizona housing market by city ratings honest.
How to read the Arizona housing market by city
Months of supply answers one question: if no new listings came on the market, how many months would it take to sell every home and condo now for sale at the current pace of sales? We use the same rule on every market page on our site:
- Under 3 months: Seller’s market. Homes sell fast, multiple offers are more common and sellers set the terms.
- 3 to 6 months: Balanced. Neither side has a clear edge; price and condition decide the deal.
- Over 6 months: Buyer’s market. Buyers have more choice, more time and more room to negotiate price, repairs and closing costs.
Read the Arizona housing market by city one city at a time: your city, the cities next to it and the home type you want. Other market gauges weigh weekly demand, such as new contracts, and can label a city differently from one week to the next. Months of supply moves more slowly, which makes it a steadier guide for a decision you will live with for years.
Arizona cities that are a buyer’s market right now
For single-family homes, Payson and Wickenburg have more than 6 months of supply. Payson has 9.4 months of supply for homes, up from 6.3 a year earlier. Wickenburg has 8.3 months of supply for homes, down from 9.9 a year earlier.
For condos and townhomes, the list is longer: Fountain Hills, Phoenix, Tempe and Glendale. In these cities, condo and townhome buyers can often ask for seller-paid closing costs, a rate buydown or repairs. Before you write an offer, a full-time dedicated buyer’s agent can pull the latest condo sales in the exact community.
Arizona cities that are a seller’s market right now
Sun Lakes and Sun City West are under 3 months of supply for single-family homes. Sun Lakes sits at 2.9 months. Sun City West sits at 2.4 months. Both are 55+ communities, where demand from retirees and winter residents keeps inventory tight into the cooler months.
In the Arizona housing market by city, sellers here can price close to recent comparable sales and still expect solid interest. Even so, a well-prepared listing with good photos sells faster and for more. a full-time dedicated listing agent can show you the comps for your street.
Balanced cities in the Arizona housing market by city
Most of the Arizona housing market by city is balanced: 30 cities fall between 3 and 6 months of supply for homes. That includes the largest markets: Surprise (4.2), Peoria (4.0), Goodyear (3.9), Phoenix (3.9), Tempe (3.9), Glendale (3.8), Scottsdale (3.7), Gilbert (3.6), Mesa (3.2), Chandler (3.0).
Balanced does not mean the same everywhere. Cities near 6 months, such as Casa Grande (6.0), Paradise Valley (6.0), Eloy (5.2), Litchfield Park (5.2), act closer to a buyer’s market. Cities near 3 months, such as Sun City (3.4), Apache Junction (3.3), Mesa (3.2), Chandler (3.0), act closer to a seller’s market.
Is the Arizona housing market shifting toward buyers?
In the Arizona housing market by city data, compared with a year earlier, months of supply for homes rose in 20 cities and fell in 12. The biggest increases were in Payson (6.3 to 9.4), Tolleson (2.5 to 4.5), Casa Grande (4.7 to 6.0), El Mirage (3.0 to 4.2). More supply means more choice for buyers and more competition for sellers.
Where supply fell, such as Wickenburg (9.9 to 8.3), Gold Canyon (5.4 to 4.3), Coolidge (4.9 to 4.0), sellers gained a little ground.
Condos and townhomes: buyer’s or seller’s market by city
In the Arizona housing market by city, condos and townhomes carry more supply than single-family homes in almost every city we rate, so condo buyers usually have more leverage than home buyers in the same city.
| City | Condo and townhome months of supply | Condo and townhome market type | Single-family months of supply |
|---|---|---|---|
| Tempe | 7.1 | Buyer’s market | 3.9 |
| Fountain Hills | 6.5 | Buyer’s market | 4.5 |
| Glendale | 6.5 | Buyer’s market | 3.8 |
| Phoenix | 6.4 | Buyer’s market | 3.9 |
| Scottsdale | 5.7 | Balanced | 3.7 |
| Peoria | 5.3 | Balanced | 4.0 |
| Sun City | 5.2 | Balanced | 3.4 |
| Mesa | 4.6 | Balanced | 3.2 |
| Chandler | 4.2 | Balanced | 3.0 |
Associations, dues, reserves and rental rules matter as much as price. Arizona law requires sellers to give condo buyers association disclosures; see Arizona Revised Statutes 33-1260. Our Arizona condo buyer guide and Greater Phoenix condo market report go deeper.
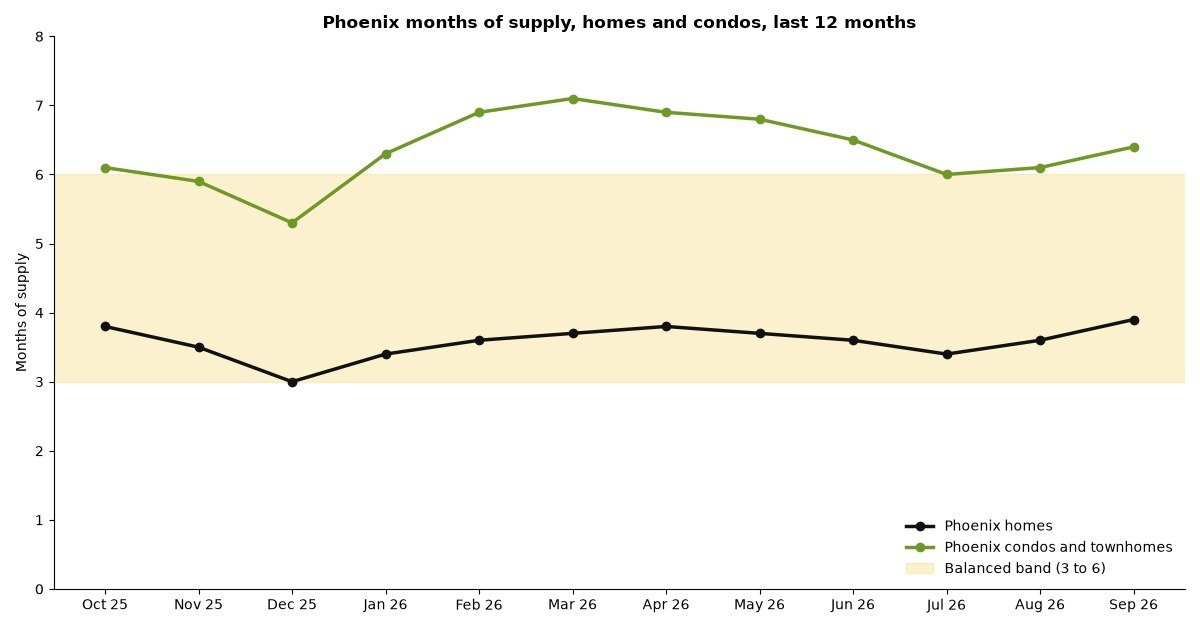
Phoenix in the Arizona housing market by city: 12-month supply trend
Phoenix is the biggest city in the Arizona housing market by city scorecard, so it is worth watching month by month. Over the last 12 months, Phoenix single-family supply ranged from 3.0 months in December 2025 to 3.9 months in September 2026. That is balanced the whole year, never a seller’s market and never a buyer’s market for homes.
Phoenix condos and townhomes tell a different story. Condo and townhome supply ran from 5.3 months in December 2025 to 7.1 months in March 2026, at or above the 6-month line in most months. Condo buyers in Phoenix have had the upper hand for most of the year.
| Month | Phoenix homes: months of supply | Phoenix condos and townhomes: months of supply | Phoenix homes for sale | Phoenix homes sold |
|---|---|---|---|---|
| October 2025 | 3.8 | 6.1 | 3,071 | 823 |
| November 2025 | 3.5 | 5.9 | 2,841 | 720 |
| December 2025 | 3.0 | 5.3 | 2,442 | 837 |
| January 2026 | 3.4 | 6.3 | 2,733 | 663 |
| February 2026 | 3.6 | 6.9 | 2,926 | 765 |
| March 2026 | 3.7 | 7.1 | 3,001 | 1,007 |
| April 2026 | 3.8 | 6.9 | 3,080 | 997 |
| May 2026 | 3.7 | 6.8 | 3,071 | 980 |
| June 2026 | 3.6 | 6.5 | 2,964 | 972 |
| July 2026 | 3.4 | 6.0 | 2,851 | 915 |
| August 2026 | 3.6 | 6.1 | 2,926 | 726 |
| September 2026 | 3.9 | 6.4 | 3,158 | 750 |
In the last 12 months, Phoenix home supply was tightest in December 2025 and highest in September 2026, so watch the next two monthly updates before you time a sale or an offer around the season. For the full Phoenix picture, read our Phoenix homes and condos market report.
What a buyer’s market means for you
- Negotiate more than price. In buyer’s and soft balanced markets, ask for closing cost help, a rate buydown or repairs.
- Check the days on market. A home that has sat longer than its neighbors often has more room to negotiate.
- Verify the parcel. Look up tax and ownership records on the county assessor site, such as the Maricopa County Assessor, before you write an offer.
- Use a specialist. a full-time dedicated buyer’s agent knows which sellers are motivated and which comps matter.
What a seller’s or balanced market means for sellers
In balanced and buyer’s markets, the first two weeks on the market matter most. Price to the most recent closed sales, not to last spring, and fix the items a buyer inspection will flag. Check the Arizona housing market by city scorecard for your city first. Our best time to sell a home in Phoenix guide shows how prices and supply move month by month, and our free Arizona home value report gives you a starting price.
Fair housing
Our Arizona housing market by city ratings describe markets by supply and sales, never by who lives in a neighborhood. Every buyer and seller is entitled to equal treatment under the federal Fair Housing Act (U.S. Department of Housing and Urban Development) and the Arizona Fair Housing Act (Arizona Attorney General).
How we rate each city
Data: each city’s months of supply comes from our monthly closed-sales data for that city, reported separately for single-family homes and for condos and townhomes. We use the months of supply figure exactly as reported each month: homes for sale at month end compared with the recent monthly pace of sales. We do not estimate, blend or adjust it.
Rule: every Arizona housing market by city rating follows one rule: under 3 months is a seller’s market, 3 to 6 months is balanced and over 6 months is a buyer’s market. Year-earlier figures are the same month one year before, as reported.
Coverage: we rate a city only when we have a citywide single-family figure we trust for the latest month. We left out 65 cities and towns where that figure is not available yet, mostly small towns and areas reported only at the county or ZIP code level. Ask us and we will pull current comps for any of them, including Tucson, Flagstaff, Prescott and Yuma. Explore every city in our Arizona market reports for homes and condos.
Arizona housing market by city FAQ
Is Arizona a buyer’s market right now?
Mostly no. As of November 2026, 30 of the 34 Arizona cities we rate are balanced for single-family homes, 2 are a buyer’s market (Payson and Wickenburg) and 2 are a seller’s market (Sun Lakes and Sun City West). Condos and townhomes lean toward buyers in 4 of 9 rated cities.
Is Phoenix a buyer’s market right now?
For single-family homes, Phoenix is balanced at 3.9 months of supply. For condos and townhomes, Phoenix is a buyer’s market at 6.4 months.
Which Arizona city has the most homes for sale relative to sales?
Payson has the highest months of supply we track for homes at 9.4 months. Sun City West has the lowest at 2.4 months.
What is months of supply?
Months of supply is the number of months it would take to sell every home and condo now for sale at the current pace of sales if no new listings came on. Under 3 is a seller’s market, 3 to 6 is balanced and over 6 is a buyer’s market.
How often is this Arizona housing market by city page updated?
We update the Arizona housing market by city page every month, after the latest full month of closings is complete for each city.
Buying or selling? Get the numbers for your exact city
Tell us the city, budget and timing, and use the Arizona housing market by city scorecard above as your starting point. a full-time dedicated buyer’s agent or a full-time dedicated listing agent will send current comps for homes and condos where you plan to buy or sell.
Talk to a full-time dedicated buyer’s agent or listing agent
Two quick steps. A full-time local agent replies personally.
Do you know anyone looking to buy or sell real estate in Arizona? Share our website with them so they are fully informed.
Call Arizona Homes and Condos Realty at (480) 490-4865 or visit ArizonaHomesandCondos.com.