
Greater Phoenix condo and townhome market report
Greater Phoenix Condo Market Report — November 2026 (Homes and Condos)
This Greater Phoenix condo market report tracks condos and townhomes across the metro and in Phoenix, Scottsdale, Tempe, Mesa, Chandler, Gilbert, Glendale and Peoria. Use it with our city reports on homes and condos before you buy or sell a home or condo.
Greater Phoenix condo market report key facts
- The Greater Phoenix condo and townhome median is $320,000, 3.9% lower than a year earlier.
- 610 condos and townhomes closed, taking 93 days on market.
- 3,991 are for sale, equal to 6.4 months of supply on our three-month method: a buyer’s market.
- Scottsdale has the top median ($485,000); Glendale has the lowest ($222,500).
Buying a home or condo? Answer a few quick questions and a full-time local agent replies personally.
TALK TO A FULL-TIME DEDICATED BUYER’S AGENTGreater Phoenix condo market report snapshot: November 2026
This Greater Phoenix condo market report covers condos and townhomes across Maricopa County. In the latest month of closings, 610 condos and townhomes sold at a $320,000 median, 3.9% lower than $333,000 a year earlier.
| Condos and townhomes | Latest month | Change |
|---|---|---|
| Median sale price | $320,000 | -3.9% vs a year earlier |
| Closed sales | 610 | -5.7% vs a year earlier |
| Pending sales | 368 | 420 the month before |
| New listings | 1,138 | 1,028 the month before |
| Condos and townhomes for sale | 3,991 | 3,713 the month before |
| Days on market | 93 | 99 the month before |
| Share of list price received | 97.2% | 97.3% the month before |
| Months of supply | 5.8 | 5.3 the month before |
Inventory rose to 3,991 condos and townhomes for sale, up from 3,713 the month before. That equals 5.8 months of supply on the latest month alone and 6.4 months on our three-month average, so the Phoenix condo market leans toward buyers at the metro level. Pending sales slipped to 368 from 420, which points to a slower pace of closings into November.
Year to date, 6,598 condos and townhomes have closed across Greater Phoenix at a $330,000 median. Sellers received 97.2% of list price on average, so most buyers are still negotiating a few points off the asking price.
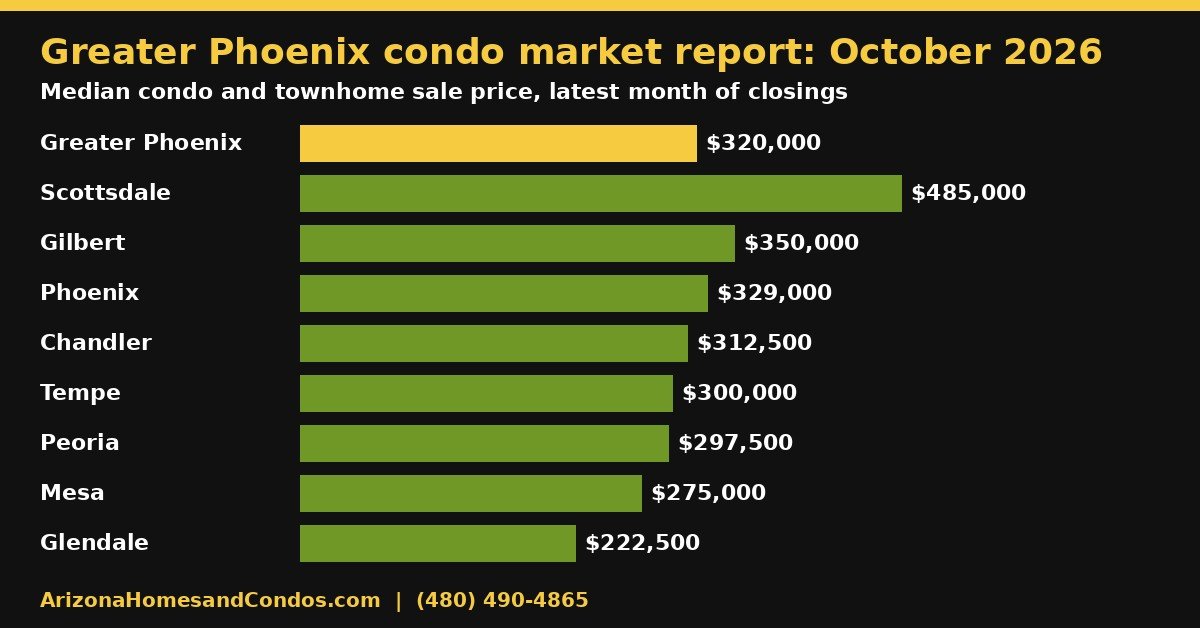
Phoenix condo prices by city: November 2026 comparison
Phoenix condo prices vary widely across the Valley. The table below compares every city in this Greater Phoenix condo market report side by side, using the latest month of closings.
| City | Median | Vs a year earlier | Closed | For sale | Months of supply | Days on market |
|---|---|---|---|---|---|---|
| Greater Phoenix (Maricopa County) | $320,000 | -3.9% | 610 | 3,991 | 5.8 | 93 |
| Phoenix | $329,000 | +2.8% | 192 | 1,348 | 6.4 | 92 |
| Scottsdale | $485,000 | -3.5% | 154 | 1,000 | 5.7 | 109 |
| Tempe | $300,000 | -8.3% | 33 | 240 | 7.1 | 69 |
| Mesa | $275,000 | -2.7% | 76 | 412 | 4.6 | 78 |
| Chandler | $312,500 | -13.0% | 22 | 135 | 4.2 | 87 |
| Gilbert | $350,000 | -9.1% | 8 | 85 | 5.8 | 111 |
| Glendale | $222,500 | -13.6% | 24 | 135 | 6.5 | 89 |
| Peoria | $297,500 | -22.0% | 16 | 82 | 5.3 | 70 |
Swipe to see more →
Months of supply runs from 4.2 in Chandler to 7.1 in Tempe. Under 3 months favors sellers, 3 to 6 is balanced and over 6 favors buyers. Phoenix, Tempe, Glendale sit in buyer’s-market territory for condos and townhomes right now.
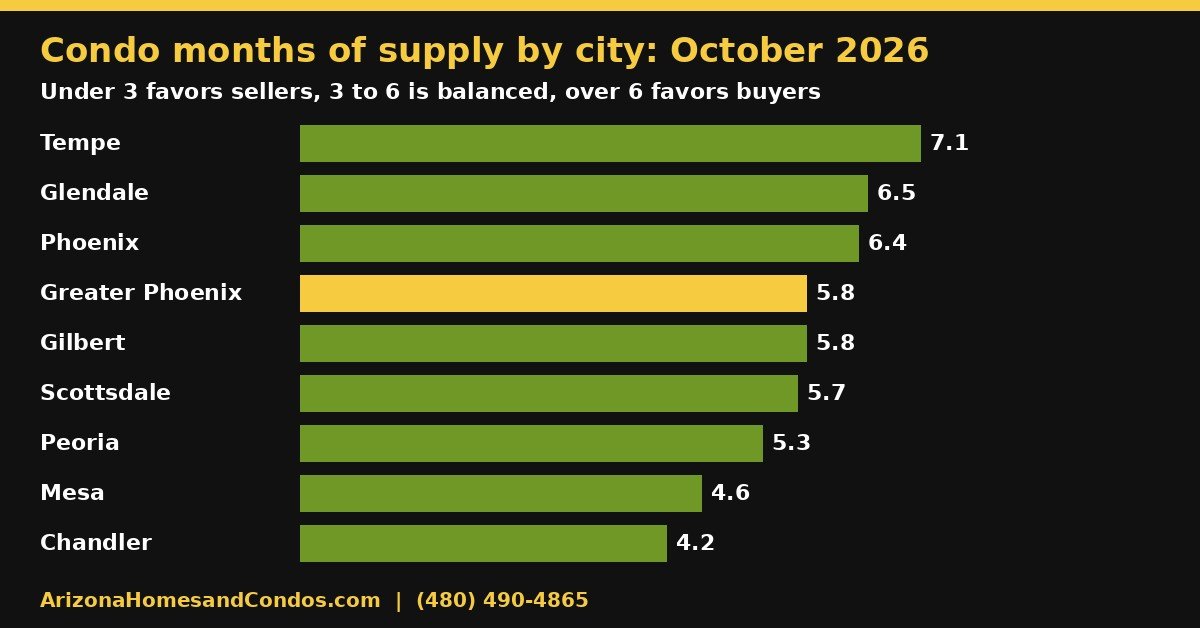
Scottsdale condos for sale versus the rest of the Valley
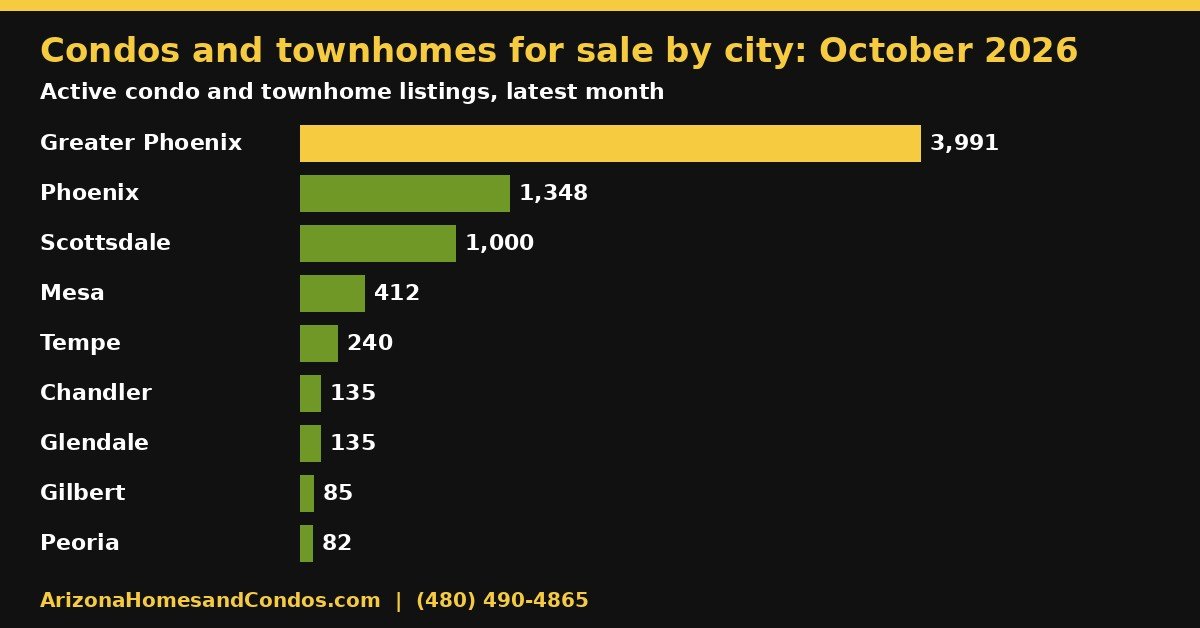
Scottsdale condos for sale carry the top median at $485,000, and 1,000 Scottsdale condos and townhomes were for sale. Glendale sits at the other end at $222,500, so the same budget buys very different square footage and amenities across the metro.
Townhomes for sale in Phoenix and nearby cities
Our numbers combine condos and townhomes, because both trade under the same association rules in most communities. Townhomes for sale in Phoenix usually offer an attached garage and a small yard, while many condos share walls on more than one side. Ask a full-time dedicated condo agent which type fits your budget and plans.
Selling a home or condo? Answer a few quick questions and a full-time local agent replies personally.
TALK TO A FULL-TIME DEDICATED LISTING AGENTMonths of supply and buyer’s or seller’s market by city
Months of supply tells you how long the condos and townhomes for sale today would take to sell at the recent pace of closings. In this Greater Phoenix condo market report, we divide active condo and townhome listings at the end of the latest month by the average monthly closed sales over the trailing three months (July, August and September closings). A three-month average smooths out one slow or busy month, so it can differ from the single-month figure in the tables above.
We use the standard thresholds: under 4 months is a seller’s market, 4 to 6 months is balanced, and over 6 months is a buyer’s market.
| Area | Active condos and townhomes | Closed sales, last 3 months | Average closed per month | Months of supply | Market type |
|---|---|---|---|---|---|
| Greater Phoenix (Maricopa County) | 3,991 | 665, 582, 610 | 619.0 | 6.4 | Buyer’s market |
| Phoenix | 1,348 | 211, 172, 192 | 191.7 | 7.0 | Buyer’s market |
| Scottsdale | 1,000 | 153, 140, 154 | 149.0 | 6.7 | Buyer’s market |
| Tempe | 240 | 36, 30, 33 | 33.0 | 7.3 | Buyer’s market |
| Mesa | 412 | 95, 64, 76 | 78.3 | 5.3 | Balanced market |
| Chandler | 135 | 37, 31, 22 | 30.0 | 4.5 | Balanced market |
| Gilbert | 85 | 14, 17, 8 | 13.0 | 6.5 | Buyer’s market |
| Glendale | 135 | 30, 22, 24 | 25.3 | 5.3 | Balanced market |
| Peoria | 82 | 17, 17, 16 | 16.7 | 4.9 | Balanced market |
- Greater Phoenix (Maricopa County): 6.4 months of supply, a buyer’s market.
- Phoenix: 7.0 months of supply, a buyer’s market.
- Scottsdale: 6.7 months of supply, a buyer’s market.
- Tempe: 7.3 months of supply, a buyer’s market.
- Mesa: 5.3 months of supply, a balanced market.
- Chandler: 4.5 months of supply, a balanced market.
- Gilbert: 6.5 months of supply, a buyer’s market.
- Glendale: 5.3 months of supply, a balanced market.
- Peoria: 4.9 months of supply, a balanced market.
Across Greater Phoenix, 3,991 condos and townhomes are for sale against an average of 619 closings a month, or 6.4 months of supply: a buyer’s market. Phoenix, Scottsdale, Tempe and Gilbert are buyer’s markets, and Mesa, Chandler, Glendale and Peoria are balanced. None of the eight cities is a seller’s market right now. Every input comes from our own closed-sales and listing counts for homes and condos; we never estimate a missing month.
Phoenix condos and townhomes: November 2026
Phoenix is the largest condo and townhome market in the Valley, from downtown and midtown high-rises to garden-style communities in north Phoenix and Ahwatukee. The Phoenix condo and townhome median was $329,000 in the latest month of closings, 2.8% higher than $320,000 a year earlier. 192 condos and townhomes closed, and 1,348 were for sale.
| Condos and townhomes | Latest month | Change |
|---|---|---|
| Median sale price | $329,000 | +2.8% vs a year earlier |
| Closed sales | 192 | -13.5% vs a year earlier |
| Pending sales | 137 | 143 the month before |
| New listings | 366 | 347 the month before |
| Condos and townhomes for sale | 1,348 | 1,294 the month before |
| Days on market | 92 | 99 the month before |
| Share of list price received | 97.3% | 97.4% the month before |
| Months of supply | 6.4 | 6.1 the month before |
On our three-month method, the Phoenix condo and townhome market has 7.0 months of supply, a buyer’s market. Sellers received 97.3% of list price, and the typical sale took 92 days. For single-family numbers, schools and neighborhoods, read our full Phoenix homes and condos market report.
Scottsdale condos and townhomes: November 2026
Scottsdale carries the highest condo and townhome prices in our report, led by Old Town, Kierland and the resort corridors. The Scottsdale condo and townhome median was $485,000 in the latest month of closings, 3.5% lower than $502,500 a year earlier. 154 condos and townhomes closed, and 1,000 were for sale.
| Condos and townhomes | Latest month | Change |
|---|---|---|
| Median sale price | $485,000 | -3.5% vs a year earlier |
| Closed sales | 154 | +4.1% vs a year earlier |
| Pending sales | 84 | 108 the month before |
| New listings | 294 | 261 the month before |
| Condos and townhomes for sale | 1,000 | 896 the month before |
| Days on market | 109 | 111 the month before |
| Share of list price received | 96.7% | 96.1% the month before |
| Months of supply | 5.7 | 5.1 the month before |
On our three-month method, the Scottsdale condo and townhome market has 6.7 months of supply, a buyer’s market. Sellers received 96.7% of list price, and the typical sale took 109 days. For single-family numbers, schools and neighborhoods, read our full Scottsdale homes and condos market report.
Tempe condos and townhomes: November 2026
Tempe condos and townhomes sit close to the university, Tempe Town Lake and the Loop 101 and 202 freeways, so rental rules matter here. The Tempe condo and townhome median was $300,000 in the latest month of closings, 8.3% lower than $327,000 a year earlier. 33 condos and townhomes closed, and 240 were for sale.
| Condos and townhomes | Latest month | Change |
|---|---|---|
| Median sale price | $300,000 | -8.3% vs a year earlier |
| Closed sales | 33 | -2.9% vs a year earlier |
| Pending sales | 18 | 30 the month before |
| New listings | 51 | 77 the month before |
| Condos and townhomes for sale | 240 | 240 the month before |
| Days on market | 69 | 66 the month before |
| Share of list price received | 97.1% | 97.6% the month before |
| Months of supply | 7.1 | 6.9 the month before |
On our three-month method, the Tempe condo and townhome market has 7.3 months of supply, a buyer’s market. Sellers received 97.1% of list price, and the typical sale took 69 days. For single-family numbers, schools and neighborhoods, read our full Tempe homes and condos market report.
Mesa condos and townhomes: November 2026
Mesa offers some of the lowest condo and townhome prices in the East Valley, with 55+ communities and townhomes near the Loop 202. The Mesa condo and townhome median was $275,000 in the latest month of closings, 2.7% lower than $282,500 a year earlier. 76 condos and townhomes closed, and 412 were for sale.
| Condos and townhomes | Latest month | Change |
|---|---|---|
| Median sale price | $275,000 | -2.7% vs a year earlier |
| Closed sales | 76 | +5.6% vs a year earlier |
| Pending sales | 41 | 39 the month before |
| New listings | 129 | 113 the month before |
| Condos and townhomes for sale | 412 | 382 the month before |
| Days on market | 78 | 87 the month before |
| Share of list price received | 97.6% | 97.8% the month before |
| Months of supply | 4.6 | 4.2 the month before |
On our three-month method, the Mesa condo and townhome market has 5.3 months of supply, a balanced market. Sellers received 97.6% of list price, and the typical sale took 78 days. For single-family numbers, schools and neighborhoods, read our full Mesa homes and condos market report.
Chandler condos and townhomes: November 2026
Chandler condos and townhomes draw buyers who work along the Price Road corridor and want shorter drives in the South East Valley. The Chandler condo and townhome median was $312,500 in the latest month of closings, 13.0% lower than $359,000 a year earlier. 22 condos and townhomes closed, and 135 were for sale.
| Condos and townhomes | Latest month | Change |
|---|---|---|
| Median sale price | $312,500 | -13.0% vs a year earlier |
| Closed sales | 22 | -29.0% vs a year earlier |
| Pending sales | 12 | 19 the month before |
| New listings | 43 | 29 the month before |
| Condos and townhomes for sale | 135 | 129 the month before |
| Days on market | 87 | 82 the month before |
| Share of list price received | 98.2% | 98.6% the month before |
| Months of supply | 4.2 | 4.0 the month before |
On our three-month method, the Chandler condo and townhome market has 4.5 months of supply, a balanced market. Sellers received 98.2% of list price, and the typical sale took 87 days. For single-family numbers, schools and neighborhoods, read our full Chandler homes and condos market report.
Gilbert condos and townhomes: November 2026
Gilbert has a small condo and townhome segment, so a few sales can move the median a long way in any month. The Gilbert condo and townhome median was $350,000 in the latest month of closings, 9.1% lower than $385,000 a year earlier. 8 condos and townhomes closed, and 85 were for sale.
| Condos and townhomes | Latest month | Change |
|---|---|---|
| Median sale price | $350,000 | -9.1% vs a year earlier |
| Closed sales | 8 | +14.3% vs a year earlier |
| Pending sales | 4 | 7 the month before |
| New listings | 24 | 24 the month before |
| Condos and townhomes for sale | 85 | 79 the month before |
| Days on market | 111 | 111 the month before |
| Share of list price received | 98.1% | 98.1% the month before |
| Months of supply | 5.8 | 5.2 the month before |
On our three-month method, the Gilbert condo and townhome market has 6.5 months of supply, a buyer’s market. Sellers received 98.1% of list price, and the typical sale took 111 days. For single-family numbers, schools and neighborhoods, read our full Gilbert homes and condos market report.
Glendale condos and townhomes: November 2026
Glendale posts the lowest condo and townhome median in our report, with communities near Arrowhead and the Westgate sports district. The Glendale condo and townhome median was $222,500 in the latest month of closings, 13.6% lower than $257,500 a year earlier. 24 condos and townhomes closed, and 135 were for sale.
| Condos and townhomes | Latest month | Change |
|---|---|---|
| Median sale price | $222,500 | -13.6% vs a year earlier |
| Closed sales | 24 | -7.7% vs a year earlier |
| Pending sales | 11 | 12 the month before |
| New listings | 29 | 31 the month before |
| Condos and townhomes for sale | 135 | 130 the month before |
| Days on market | 89 | 76 the month before |
| Share of list price received | 98.2% | 97.5% the month before |
| Months of supply | 6.5 | 6.3 the month before |
On our three-month method, the Glendale condo and townhome market has 5.3 months of supply, a balanced market. Sellers received 98.2% of list price, and the typical sale took 89 days. For single-family numbers, schools and neighborhoods, read our full Glendale homes and condos market report.
Peoria condos and townhomes: November 2026
Peoria condos and townhomes are a small, quick-moving segment in the West Valley near Lake Pleasant Parkway and the Loop 101. The Peoria condo and townhome median was $297,500 in the latest month of closings, 22.0% lower than $381,250 a year earlier. 16 condos and townhomes closed, and 82 were for sale.
| Condos and townhomes | Latest month | Change |
|---|---|---|
| Median sale price | $297,500 | -22.0% vs a year earlier |
| Closed sales | 16 | +14.3% vs a year earlier |
| Pending sales | 11 | 10 the month before |
| New listings | 35 | 20 the month before |
| Condos and townhomes for sale | 82 | 65 the month before |
| Days on market | 70 | 94 the month before |
| Share of list price received | 98.8% | 98.9% the month before |
| Months of supply | 5.3 | 4.3 the month before |
On our three-month method, the Peoria condo and townhome market has 4.9 months of supply, a balanced market. Sellers received 98.8% of list price, and the typical sale took 70 days. For single-family numbers, schools and neighborhoods, read our full Peoria homes and condos market report.
What this Greater Phoenix condo market report means for buyers
With 5.8 months of supply metro-wide and sellers receiving 97.2% of list price, buyers have more room to negotiate than they did a year ago. Use this Greater Phoenix condo market report to target the cities where supply is highest, then ask for concessions on condos and townhomes that have sat past the typical 93 days on market.
- Read the association documents first. Arizona law requires condo sellers to provide association information to buyers; see Arizona Revised Statutes 33-1260 for condos and Arizona Revised Statutes 33-1806 for planned communities.
- Check rental rules. Some associations cap or restrict rentals, which matters for investors and for resale value.
- Compare dues and reserves. Monthly dues and the reserve study tell you more about future costs than the list price does.
- Verify the parcel. Look up tax and ownership records on the Maricopa County Assessor’s Office site before you write an offer.
- Use a specialist. A dedicated buyer’s agent who works condos every day can spot special assessments and litigation in the resale packet.
New to condos? Our Arizona condo buyer guide explains associations, dues and financing step by step.
Buying, selling or renting out a home or condo in Arizona? Answer a few quick questions and a full-time local agent replies personally.
TALK TO A FULL-TIME DEDICATED AGENTSelling a condo or townhome in Greater Phoenix this fall
Sellers face more competition: 1,138 new condo and townhome listings came on the market metro-wide in the latest month, against 610 closings. Price to the most recent comparable sales in your own community, not to last spring.
Order the association resale packet early, fix small items buyers will flag, and plan for 93 or more days on market. A dedicated seller’s agent can show you comps for your exact building or townhome row.
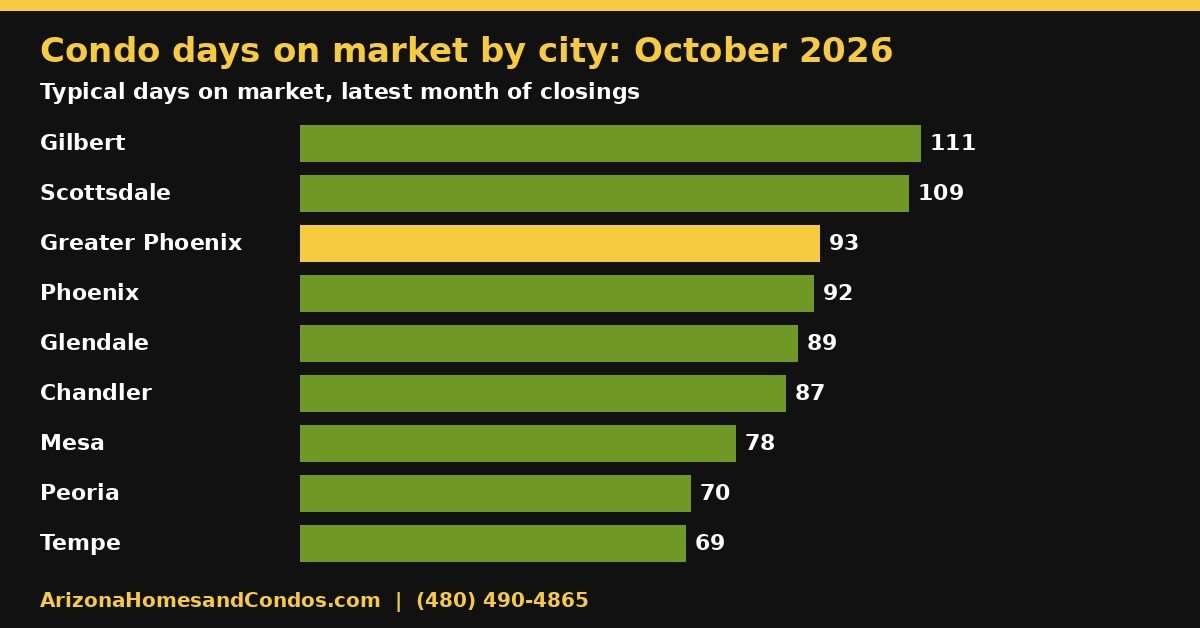
How we build this Greater Phoenix condo market report
We report condos and townhomes as their own segment, separate from single-family sales, so you see the condo market on its own. Every figure comes from our monthly closed-sales data for each city, cross-checked before we publish. We never estimate or fill a missing number. We refresh this report every month.
Data note: this November 2026 edition uses the latest full month of closings; months of supply by city uses the trailing three months. On this page, median price and closed sales compare with a year earlier, and the other rows compare with the month before. Ask us for year-earlier detail on any city.
Greater Phoenix condo market report FAQ
What is the median condo price in Greater Phoenix in November 2026?
The Greater Phoenix condo and townhome median was $320,000 in the latest month of closings, 3.9% lower than $333,000 a year earlier.
Is Greater Phoenix a buyer’s market for condos right now?
At 6.4 months of supply on our three-month method, Greater Phoenix is a buyer’s market for condos and townhomes. Phoenix, Scottsdale, Tempe and Gilbert are buyer’s markets; Mesa, Chandler, Glendale and Peoria are balanced. No city in our report is a seller’s market (under 4 months).
Which city has the highest condo prices in Greater Phoenix?
Scottsdale has the highest condo and townhome median in our report at $485,000. Glendale has the lowest at $222,500.
How long do condos take to sell in Greater Phoenix?
Condos and townhomes took 93 days on market metro-wide in the latest month, compared with 99 days the month before.
How many condos and townhomes are for sale in Greater Phoenix?
3,991 condos and townhomes were for sale across Maricopa County, up from 3,713 the month before.
How often is this condo market report updated?
We update this Greater Phoenix condo market report every month with the latest full month of closings for the metro and each city.
More condo and city market reports
Compare this report with the Maricopa County homes and condos guide and each city report: Phoenix, Scottsdale, Tempe, Mesa, Chandler, Gilbert, Glendale, Peoria.
Your next condo or townhome move starts with one message
Tell us the city, budget and timing, and a full-time dedicated condo agent will send you current condo and townhome comps for your building or community.
Buying, selling or renting out a home or condo in Arizona? Answer a few quick questions and a full-time local agent replies personally.
TALK TO A FULL-TIME DEDICATED AGENTDo you know anyone looking to buy or sell real estate in Arizona? Share our website with them so they are fully informed.
Call Arizona Homes and Condos Realty at (480) 490-4865 or visit ArizonaHomesandCondos.com.
Talk to a full-time dedicated agent
Arizona homes and condos in every city. Tell us the details below and a full-time local agent replies personally. Fields marked * are required.
Or call (480) 490-4865